Active areas
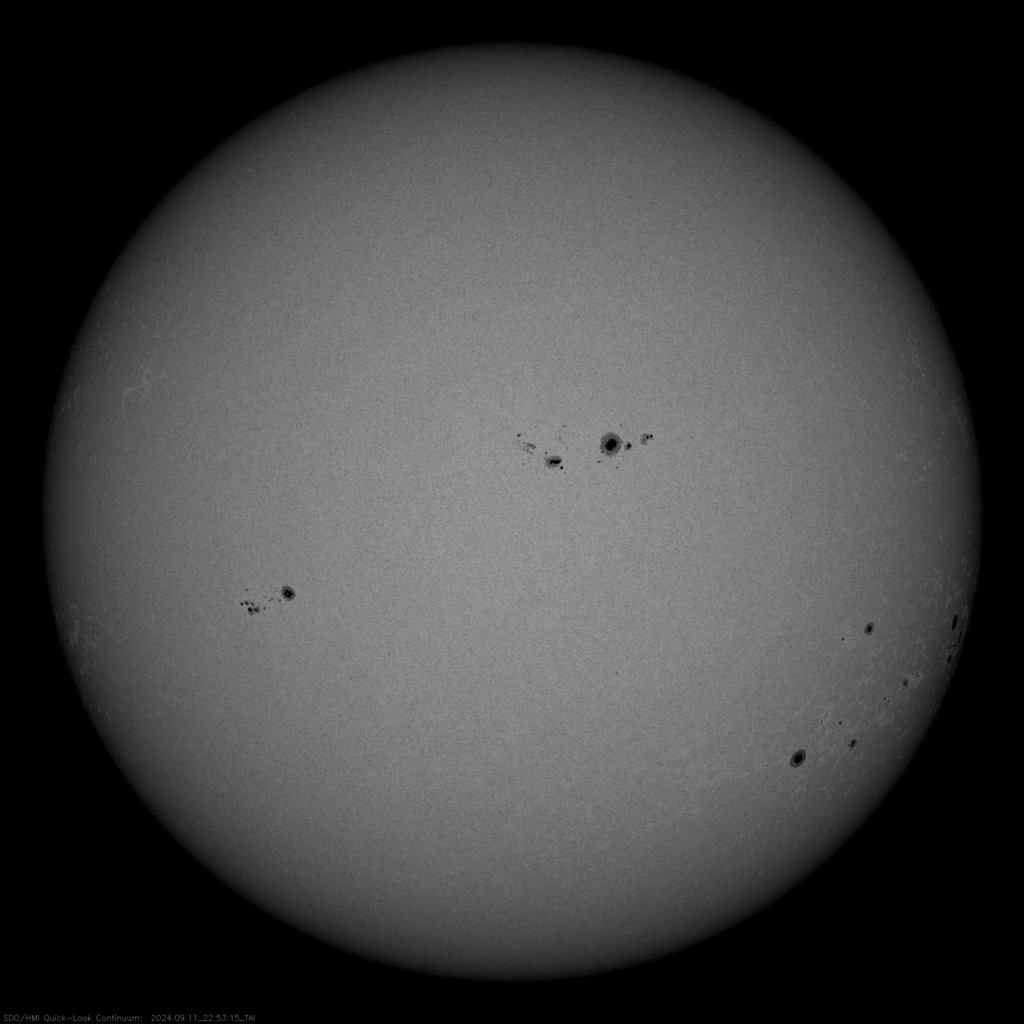
Sunspots and active regions
By the end of the day, the following active regions with sunspots could be observed on the Sun's surface
| Group ID | Location | Number of sunspots | Area (msh) | Type | CM Passage | Disappearance (W90) | Reappearance (W270) | |
|---|---|---|---|---|---|---|---|---|
| № 3822 | N14 | E24 | 12 | 0060 | Beta | Sep 13, 2024 | Sep 20, 2024 | Oct 3, 2024 |
| № 3821 | N13 | W50 | 06 | 0040 | Beta | Sep 7, 2024 | Sep 14, 2024 | Sep 28, 2024 |
| № 3820 | S19 | W23 | 04 | 0020 | Alpha | Sep 9, 2024 | Sep 16, 2024 | Sep 30, 2024 |
| № 3819 | S27 | W07 | 17 | 0020 | Beta | Sep 10, 2024 | Sep 17, 2024 | Oct 1, 2024 |
| № 3818 | S13 | W62 | 02 | 0005 | Beta | Sep 6, 2024 | Sep 13, 2024 | Sep 27, 2024 |
| № 3816 | S11 | W23 | 12 | 0060 | Beta | Sep 9, 2024 | Sep 16, 2024 | Sep 30, 2024 |
| № 3815 | S27 | W12 | 02 | 0140 | Alpha | Sep 10, 2024 | Sep 17, 2024 | Oct 1, 2024 |
| № 3814 | N16 | E11 | 12 | 0250 | Beta-Gamma | Sep 12, 2024 | Sep 19, 2024 | Oct 2, 2024 |
| № 3813 | S22 | W24 | 12 | 0130 | Beta | Sep 9, 2024 | Sep 16, 2024 | Sep 30, 2024 |
| № 3811 | S11 | W49 | 19 | 0230 | Beta-Gamma | Sep 7, 2024 | Sep 14, 2024 | Sep 28, 2024 |
| № 3806 | S11 | W94 | 05 | 0070 | Beta | Sep 4, 2024 | Sep 11, 2024 | Sep 24, 2024 |
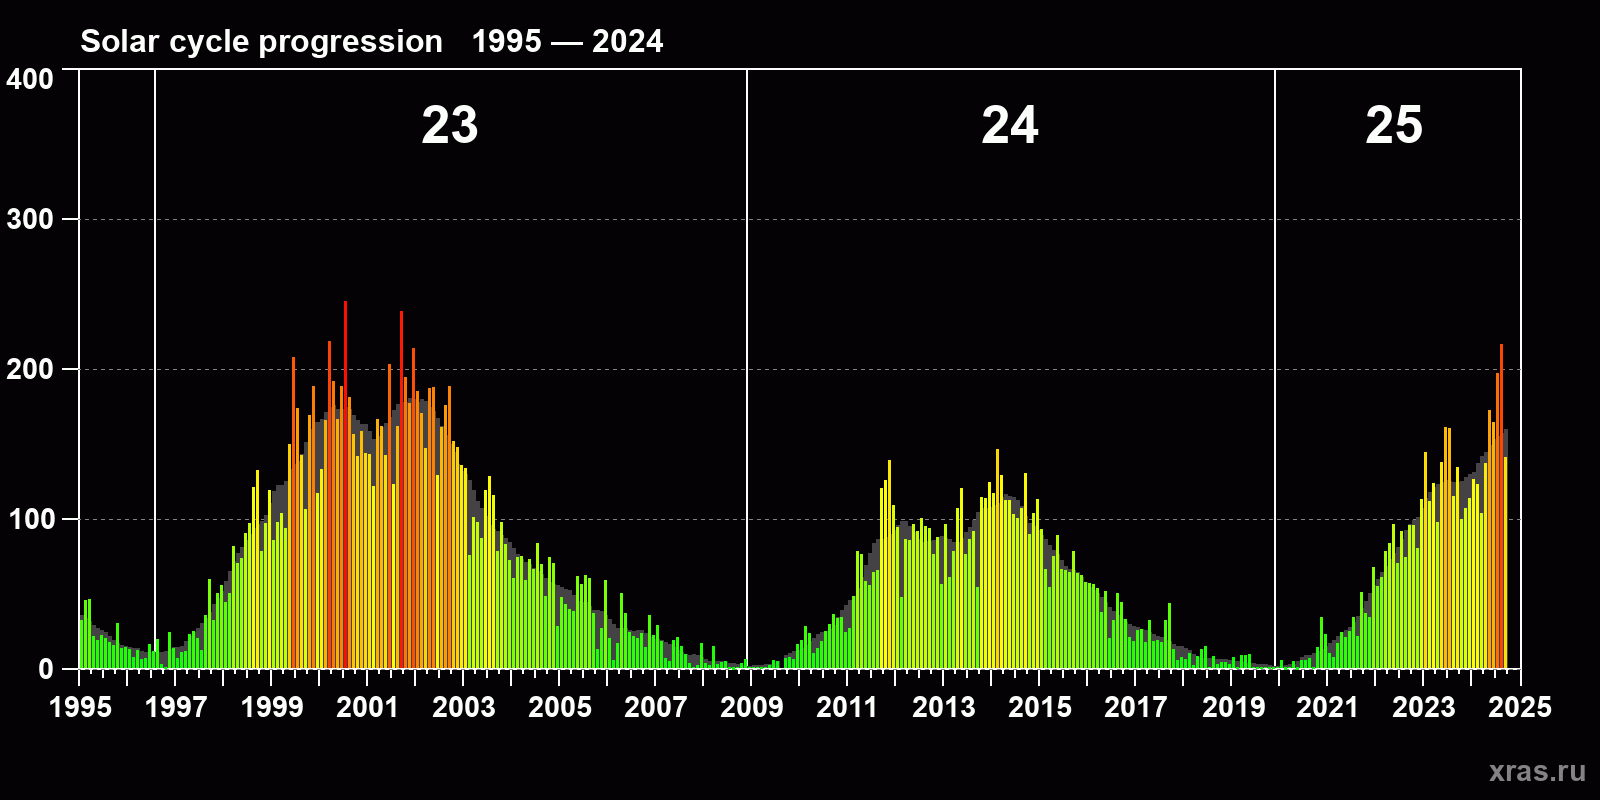
Solar cycle progression
Average monthly sunspot number (SSN) from 1995, January to 2024, September. Gray background - average solar cycle.