Active areas
Sunspots and active regions
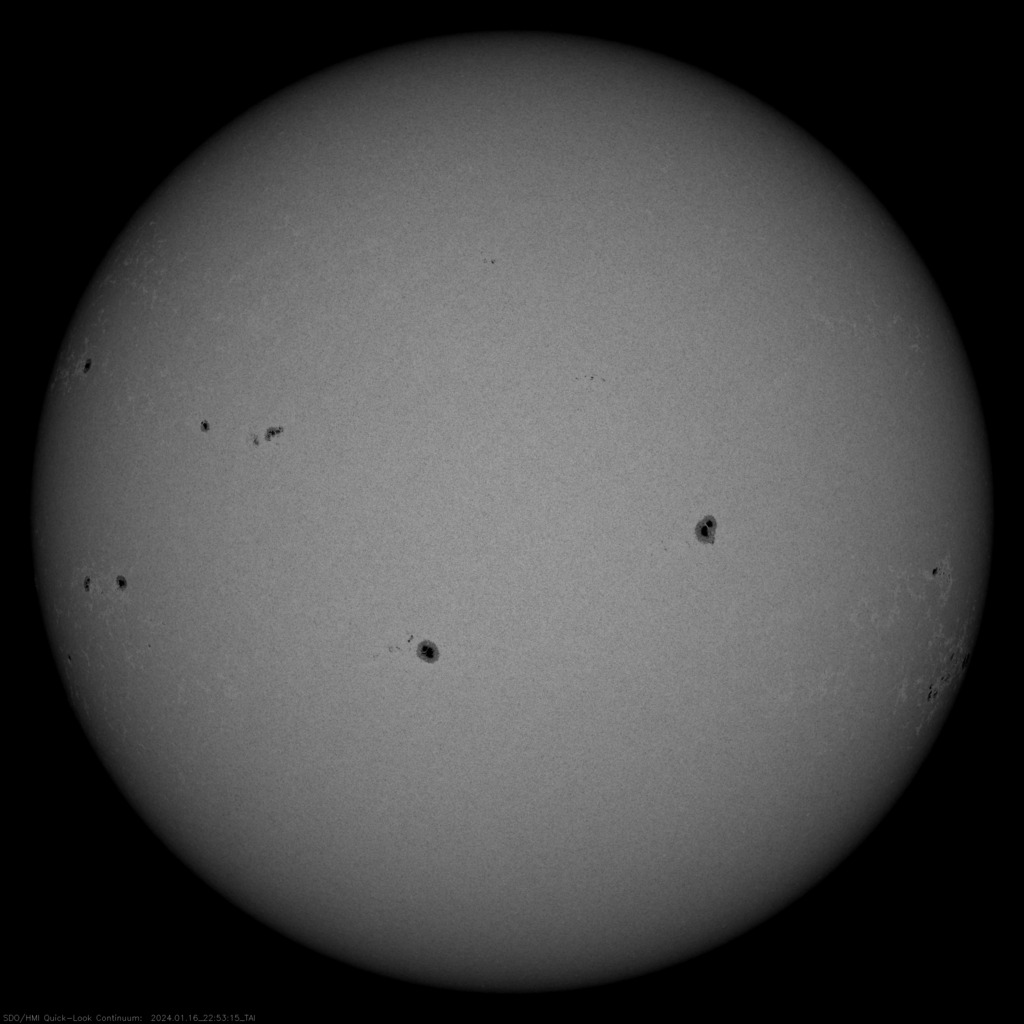
By the end of the day, the following active regions with sunspots could be observed on the Sun's surface
| Group ID | Location | Number of sunspots | Area (msh) | Type | CM Passage | Disappearance (W90) | Reappearance (W270) | |
|---|---|---|---|---|---|---|---|---|
| № 3553 | N05 | E54 | 03 | 0080 | Alpha | Jan 20, 2024 | Jan 27, 2024 | Feb 9, 2024 |
| № 3552 | S22 | W39 | 04 | 0010 | Alpha | Jan 13, 2024 | Jan 20, 2024 | Feb 3, 2024 |
| № 3551 | N26 | E25 | 03 | 0010 | Beta | Jan 18, 2024 | Jan 25, 2024 | Feb 8, 2024 |
| № 3550 | S18 | W03 | 03 | 0010 | Alpha | Jan 16, 2024 | Jan 23, 2024 | Feb 5, 2024 |
| № 3549 | S21 | E36 | 07 | 0250 | Beta | Jan 19, 2024 | Jan 26, 2024 | Feb 8, 2024 |
| № 3548 | N12 | E14 | 05 | 0040 | Beta | Jan 17, 2024 | Jan 24, 2024 | Feb 6, 2024 |
| № 3547 | N18 | W23 | 02 | 0010 | Beta | Jan 14, 2024 | Jan 21, 2024 | Feb 4, 2024 |
| № 3546 | S24 | W17 | 09 | 0010 | Beta | Jan 15, 2024 | Jan 22, 2024 | Feb 5, 2024 |
| № 3545 | S06 | E02 | 04 | 0250 | Beta | Jan 16, 2024 | Jan 23, 2024 | Feb 5, 2024 |
| № 3541 | S22 | W48 | 04 | 0050 | Beta | Jan 12, 2024 | Jan 19, 2024 | Feb 2, 2024 |
| № 3540 | S19 | W51 | 16 | 0110 | Beta-Gamma | Jan 12, 2024 | Jan 19, 2024 | Feb 2, 2024 |
| № 3539 | N13 | W96 | 03 | 0110 | Beta | Jan 9, 2024 | Jan 16, 2024 | Jan 29, 2024 |
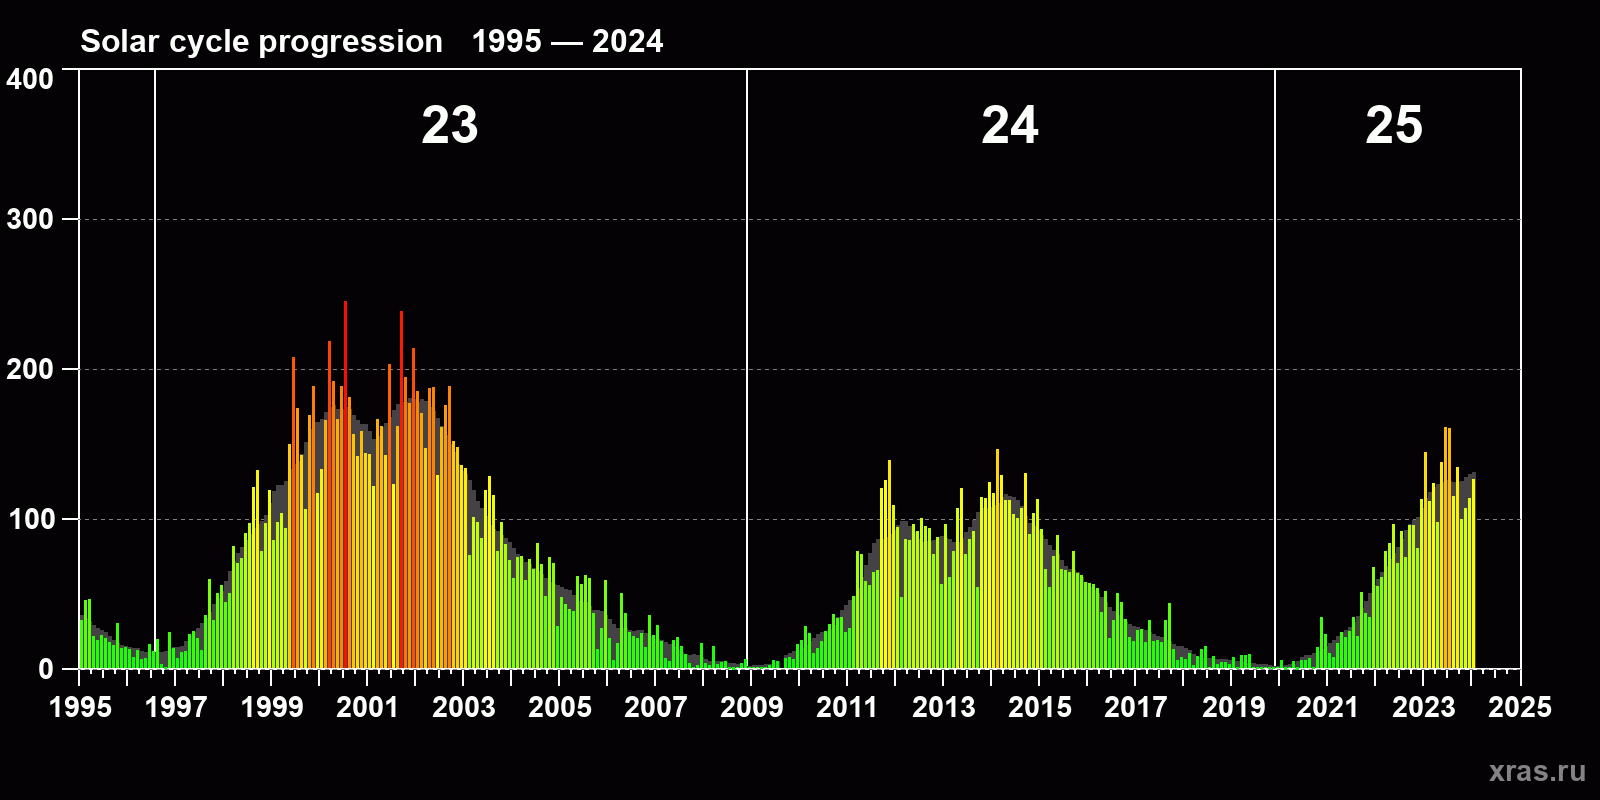
Solar cycle progression
Average monthly sunspot number (SSN) from 1995, January to 2024, January. Gray background - average solar cycle.