No image for the selected date
Sunspots and active regions
The following active regions with sunspot groups were visible on the Sun on October 19, 2011. Coordinates are given as of the end of the day.
| Group ID | Location | Number of sunspots | Area (msh) | Type | CM Passage | Disappearance (W90) | Reappearance (W270) | |
|---|---|---|---|---|---|---|---|---|
| № 1324 | N10 | E65 | 12 | 0110 | Beta | Oct 25, 2011 | Nov 1, 2011 | Nov 14, 2011 |
| № 1323 | N24 | E43 | 02 | 0020 | Beta | Oct 23, 2011 | Oct 30, 2011 | Nov 13, 2011 |
| № 1322 | S27 | W91 | 01 | 0030 | Alpha | Oct 13, 2011 | Oct 20, 2011 | Nov 3, 2011 |
| № 1321 | S14 | E11 | 06 | 0030 | Beta | Oct 21, 2011 | Oct 28, 2011 | Nov 10, 2011 |
| № 1319 | N11 | W37 | 19 | 0280 | Beta-Gamma | Oct 17, 2011 | Oct 24, 2011 | Nov 6, 2011 |
| № 1318 | N19 | W83 | 02 | 0040 | Beta | Oct 14, 2011 | Oct 20, 2011 | Nov 3, 2011 |
| № 1317 | S27 | W23 | 01 | 0050 | Alpha | Oct 18, 2011 | Oct 25, 2011 | Nov 8, 2011 |
| № 1316 | S12 | W35 | 07 | 0140 | Beta | Oct 17, 2011 | Oct 24, 2011 | Nov 7, 2011 |
| № 1314 | N26 | W41 | 04 | 0240 | Beta | Oct 17, 2011 | Oct 24, 2011 | Nov 7, 2011 |
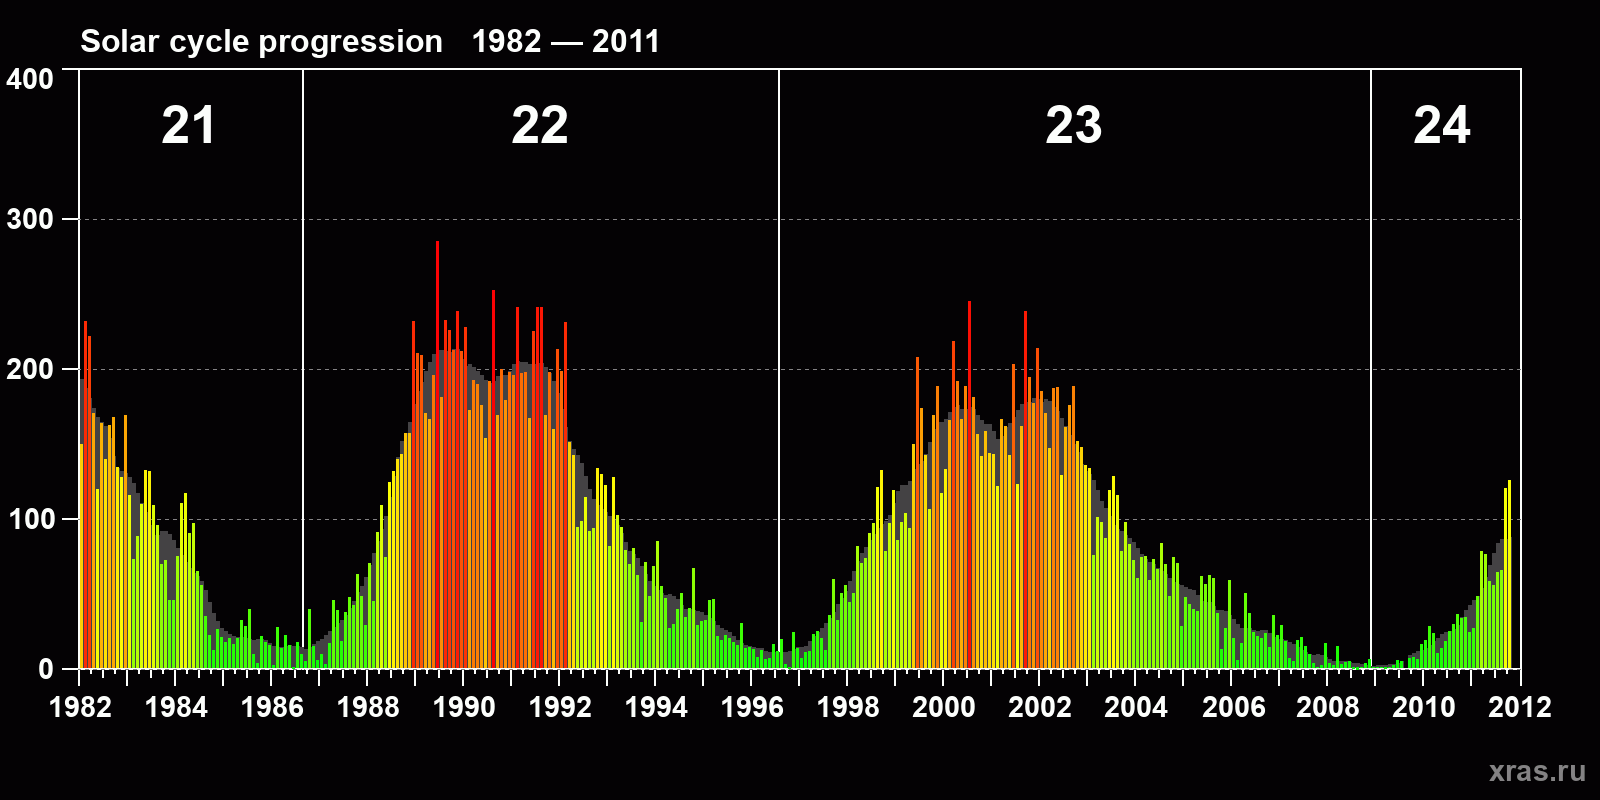
Solar cycle progression
The average monthly sunspot number (SSN) from January 1982 to October 2011. The gray background is the average SSN index.