Sunspots and active regions
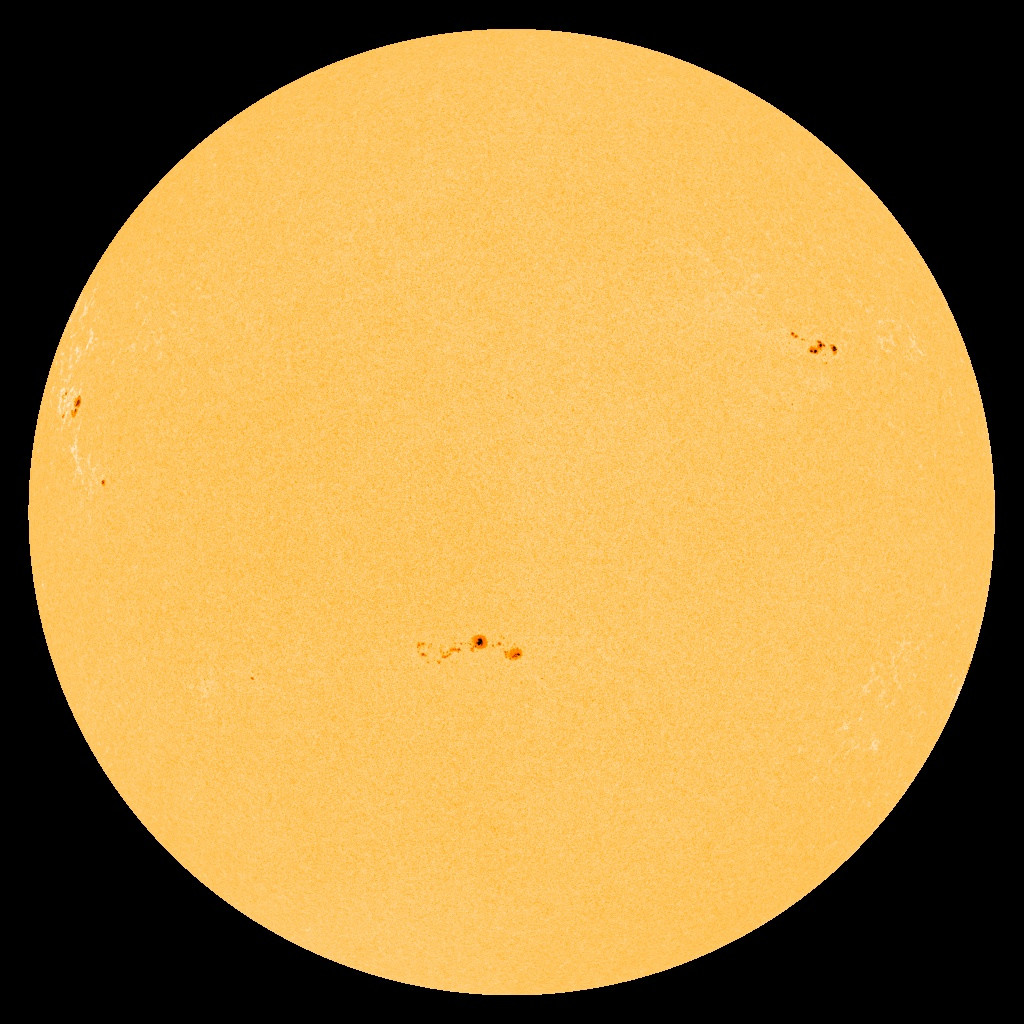
The following active regions with sunspot groups were visible on the Sun on December 20, 2011. Coordinates are given as of the end of the day.
| Group ID | Location | Number of sunspots | Area (msh) | Type | CM Passage | Disappearance (W90) | Reappearance (W270) | |
|---|---|---|---|---|---|---|---|---|
| № 1383 | N04 | E70 | 01 | 0020 | Alpha | Dec 26, 2011 | Jan 2, 2012 | Jan 15, 2012 |
| № 1382 | S18 | E20 | 12 | 0100 | Beta | Dec 22, 2011 | Dec 29, 2011 | Jan 12, 2012 |
| № 1381 | S18 | E12 | 09 | 0080 | Beta | Dec 22, 2011 | Dec 29, 2011 | Jan 11, 2012 |
| № 1380 | S20 | E45 | 06 | 0030 | Beta | Dec 24, 2011 | Dec 31, 2011 | Jan 14, 2012 |
| № 1379 | S29 | W45 | 03 | 0020 | Beta | Dec 17, 2011 | Dec 24, 2011 | Jan 7, 2012 |
| № 1377 | N13 | W22 | 03 | 0020 | Beta | Dec 19, 2011 | Dec 26, 2011 | Jan 9, 2012 |
| № 1376 | N19 | W29 | 07 | 0020 | Beta | Dec 19, 2011 | Dec 26, 2011 | Jan 8, 2012 |
| № 1375 | N08 | W81 | 01 | 0040 | Alpha | Dec 15, 2011 | Dec 22, 2011 | Jan 4, 2012 |
| № 1374 | S18 | W74 | 01 | 0070 | Alpha | Dec 15, 2011 | Dec 22, 2011 | Jan 5, 2012 |
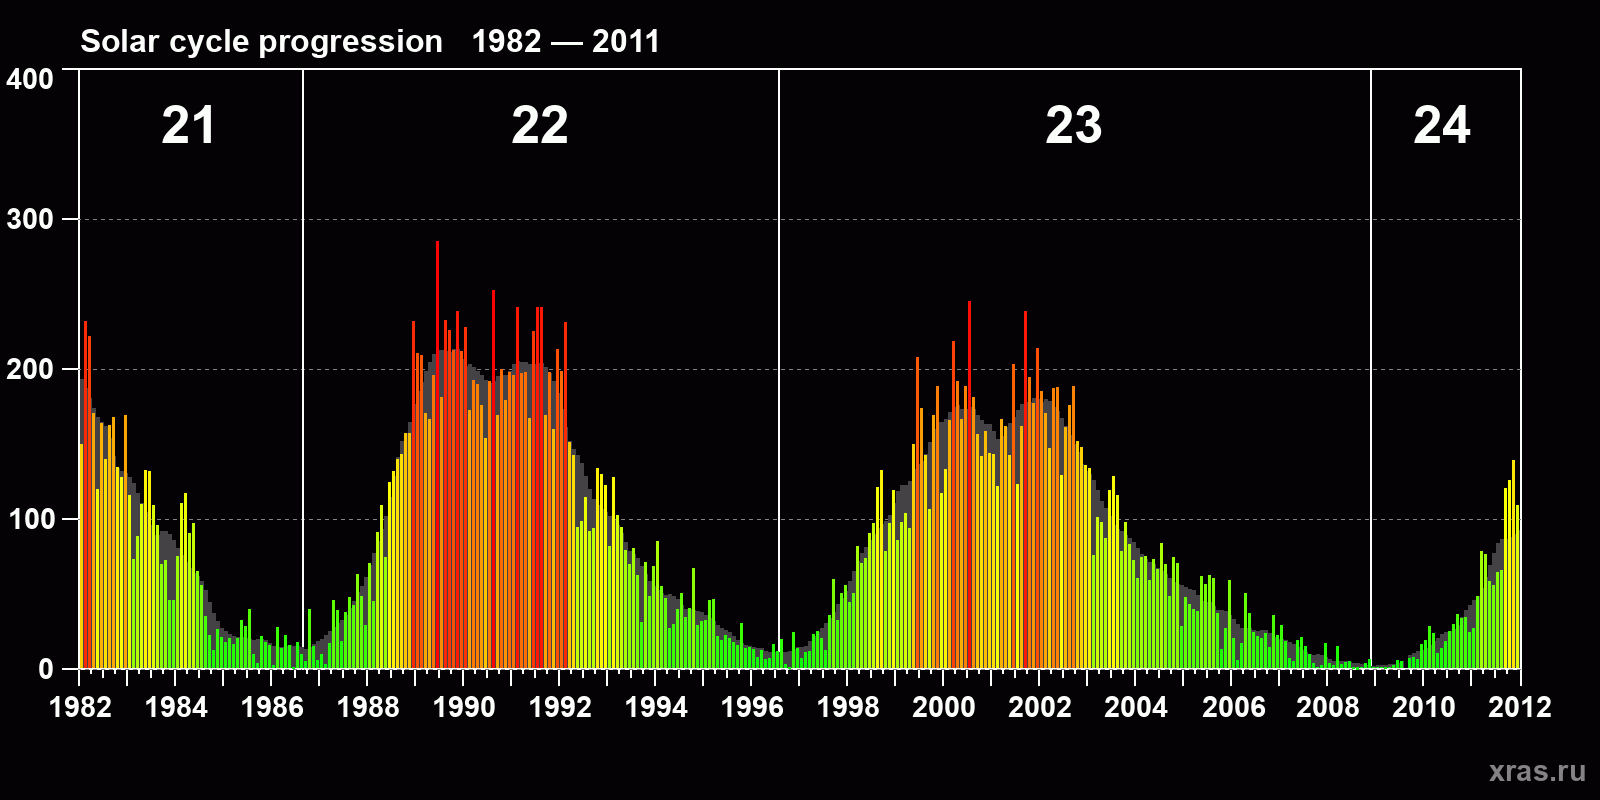
Solar cycle progression
The average monthly sunspot number (SSN) from January 1982 to December 2011. The gray background is the average SSN index.