Active areas
Sunspots and active regions
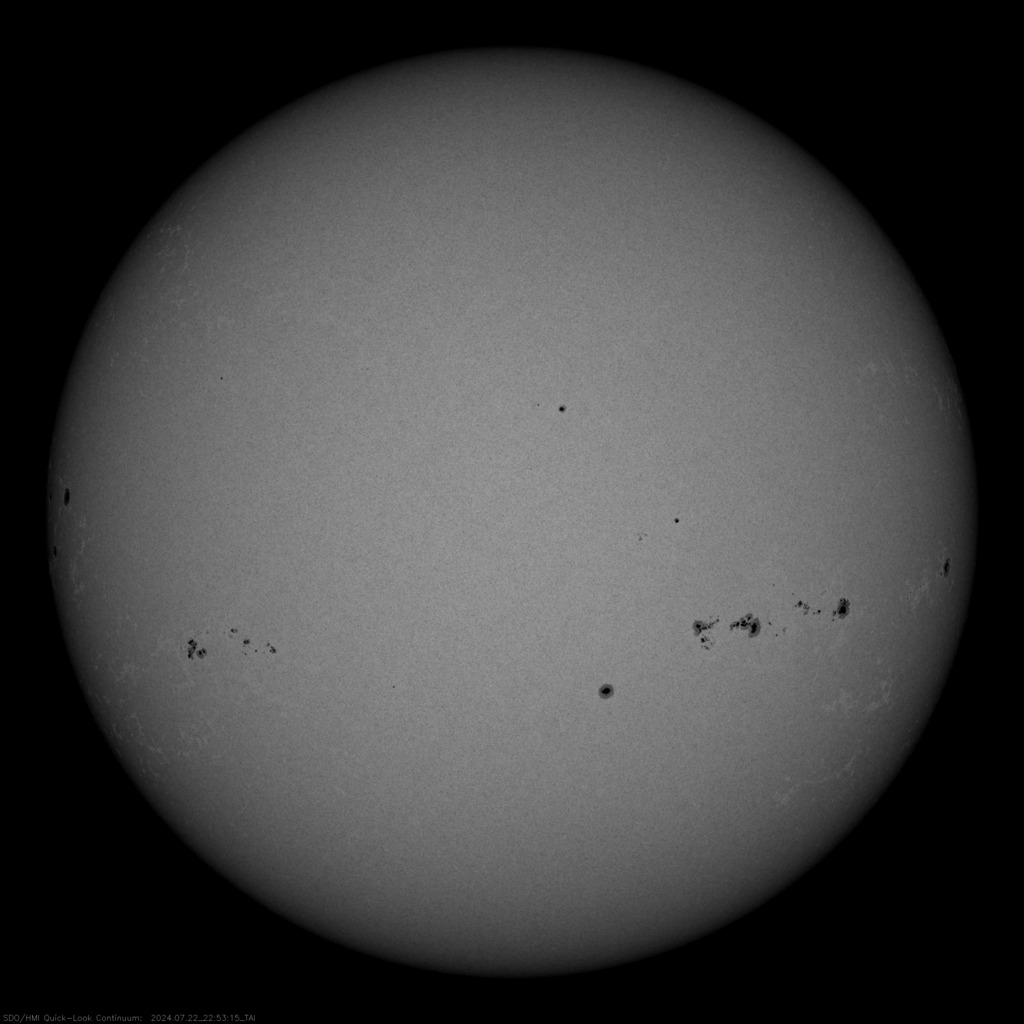
By the end of the day, the following active regions with sunspots could be observed on the Sun's surface
| Group ID | Location | Number of sunspots | Area (msh) | Type | CM Passage | Disappearance (W90) | Reappearance (W270) | |
|---|---|---|---|---|---|---|---|---|
| № 3762 | S14 | E65 | 03 | 0050 | Beta | Jul 27, 2024 | Aug 3, 2024 | Aug 16, 2024 |
| № 3761 | S10 | W00 | 12 | 0200 | Beta-Gamma | Jul 22, 2024 | Jul 29, 2024 | Aug 11, 2024 |
| № 3760 | N20 | W32 | 03 | 0010 | Beta | Jul 19, 2024 | Jul 26, 2024 | Aug 9, 2024 |
| № 3759 | S07 | W36 | 12 | 0230 | Beta | Jul 19, 2024 | Jul 26, 2024 | Aug 9, 2024 |
| № 3757 | N17 | E23 | 05 | 0040 | Beta | Jul 24, 2024 | Jul 31, 2024 | Aug 13, 2024 |
| № 3756 | S18 | E14 | 01 | 0100 | Alpha | Jul 23, 2024 | Jul 30, 2024 | Aug 13, 2024 |
| № 3755 | N02 | E07 | 05 | 0030 | Beta | Jul 22, 2024 | Jul 29, 2024 | Aug 12, 2024 |
| № 3754 | N25 | E05 | 03 | 0010 | Beta | Jul 22, 2024 | Jul 29, 2024 | Aug 12, 2024 |
| № 3752 | N22 | W12 | 01 | 0010 | Alpha | Jul 21, 2024 | Jul 28, 2024 | Aug 11, 2024 |
| № 3751 | S09 | W14 | 28 | 0380 | Beta-Gamma-Delta | Jul 21, 2024 | Jul 28, 2024 | Aug 10, 2024 |
| № 3747 | S25 | W73 | 02 | 0050 | Alpha | Jul 16, 2024 | Jul 23, 2024 | Aug 6, 2024 |
| № 3745 | S23 | W74 | 02 | 0020 | Beta | Jul 16, 2024 | Jul 23, 2024 | Aug 6, 2024 |
| № 3744 | N15 | W69 | 05 | 0030 | Beta | Jul 17, 2024 | Jul 24, 2024 | Aug 6, 2024 |
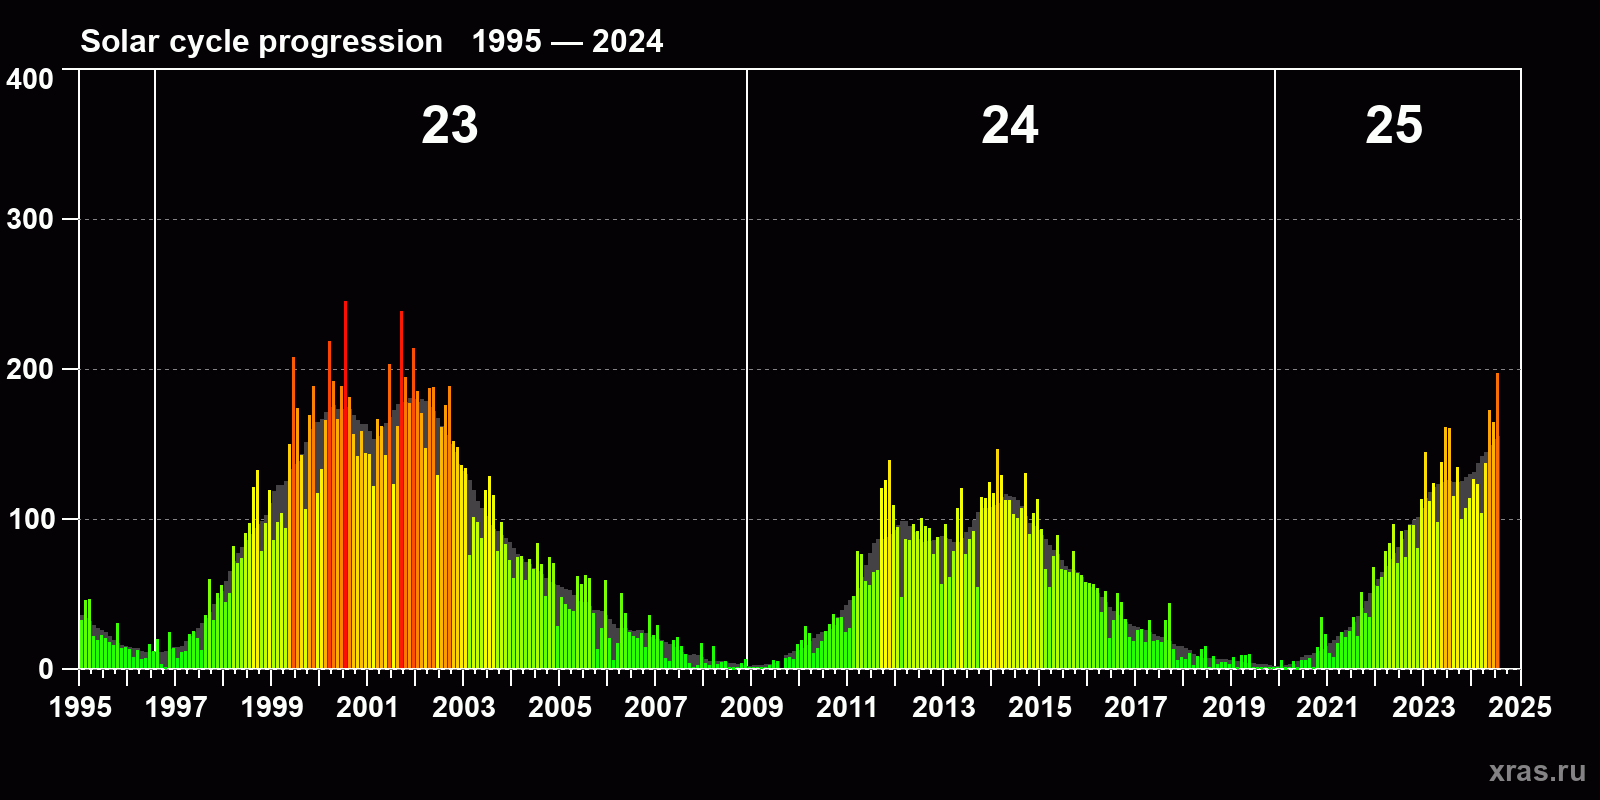
Solar cycle progression
Average monthly sunspot number (SSN) from 1995, January to 2024, July. Gray background - average solar cycle.