Active areas
Sunspots and active regions
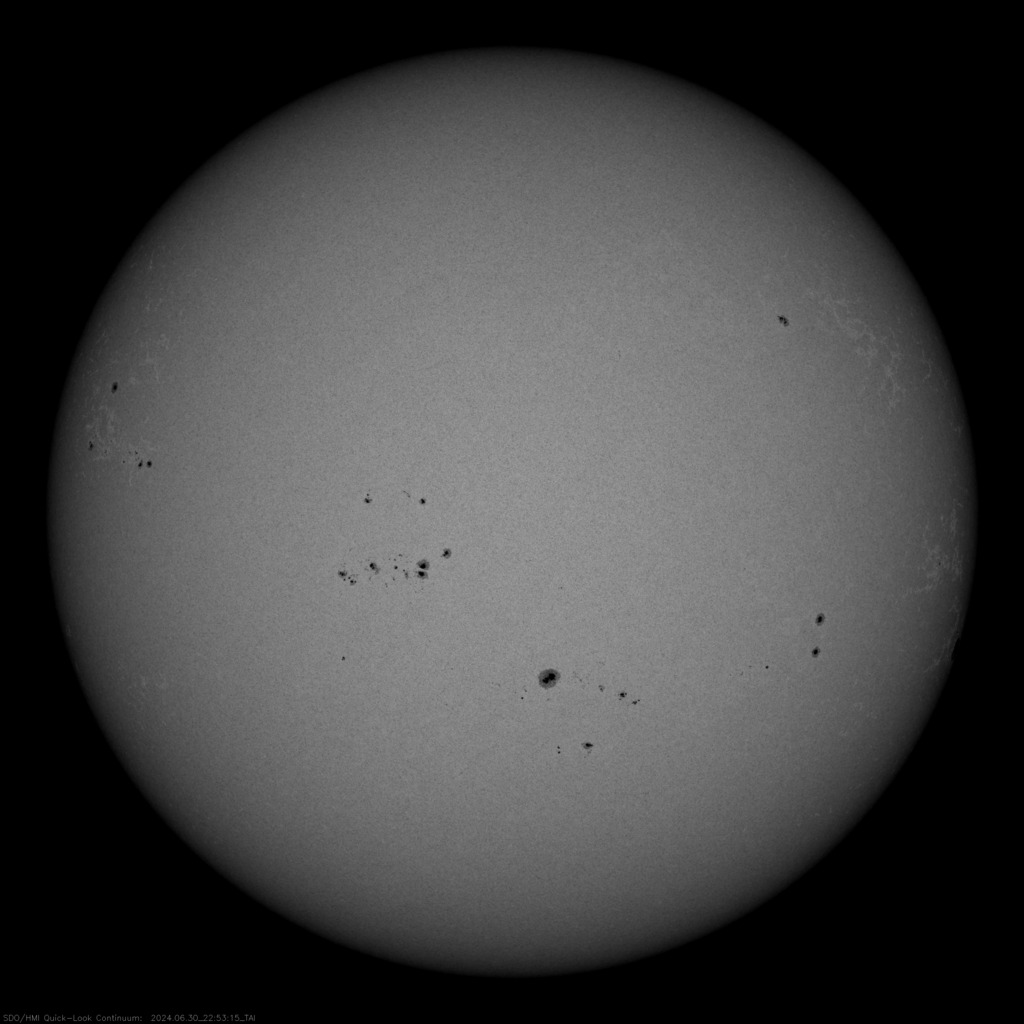
By the end of the day, the following active regions with sunspots could be observed on the Sun's surface
| Group ID | Location | Number of sunspots | Area (msh) | Type | CM Passage | Disappearance (W90) | Reappearance (W270) | |
|---|---|---|---|---|---|---|---|---|
| № 3732 | S19 | E14 | 02 | 0040 | Alpha | Jul 1, 2024 | Jul 8, 2024 | Jul 22, 2024 |
| № 3731 | S16 | E49 | 01 | 0010 | Alpha | Jul 4, 2024 | Jul 11, 2024 | Jul 24, 2024 |
| № 3730 | S18 | W05 | 05 | 0050 | Beta | Jun 30, 2024 | Jul 6, 2024 | Jul 20, 2024 |
| № 3729 | S04 | E42 | 08 | 0240 | Beta | Jul 3, 2024 | Jul 10, 2024 | Jul 23, 2024 |
| № 3728 | S27 | E17 | 05 | 0100 | Beta | Jul 1, 2024 | Jul 8, 2024 | Jul 22, 2024 |
| № 3727 | S18 | E20 | 02 | 0230 | Alpha | Jul 2, 2024 | Jul 8, 2024 | Jul 22, 2024 |
| № 3724 | S14 | W17 | 01 | 0080 | Alpha | Jun 29, 2024 | Jul 6, 2024 | Jul 19, 2024 |
| № 3723 | S20 | E07 | 06 | 0050 | Beta | Jul 1, 2024 | Jul 7, 2024 | Jul 21, 2024 |
| № 3722 | S11 | W17 | 01 | 0090 | Alpha | Jun 29, 2024 | Jul 6, 2024 | Jul 19, 2024 |
| № 3721 | N26 | W15 | 03 | 0110 | Alpha | Jun 29, 2024 | Jul 6, 2024 | Jul 20, 2024 |
| № 3720 | S05 | W43 | 05 | 0080 | Beta | Jun 27, 2024 | Jul 4, 2024 | Jul 17, 2024 |
| № 3719 | S16 | W55 | 03 | 0240 | Beta | Jun 26, 2024 | Jul 3, 2024 | Jul 16, 2024 |
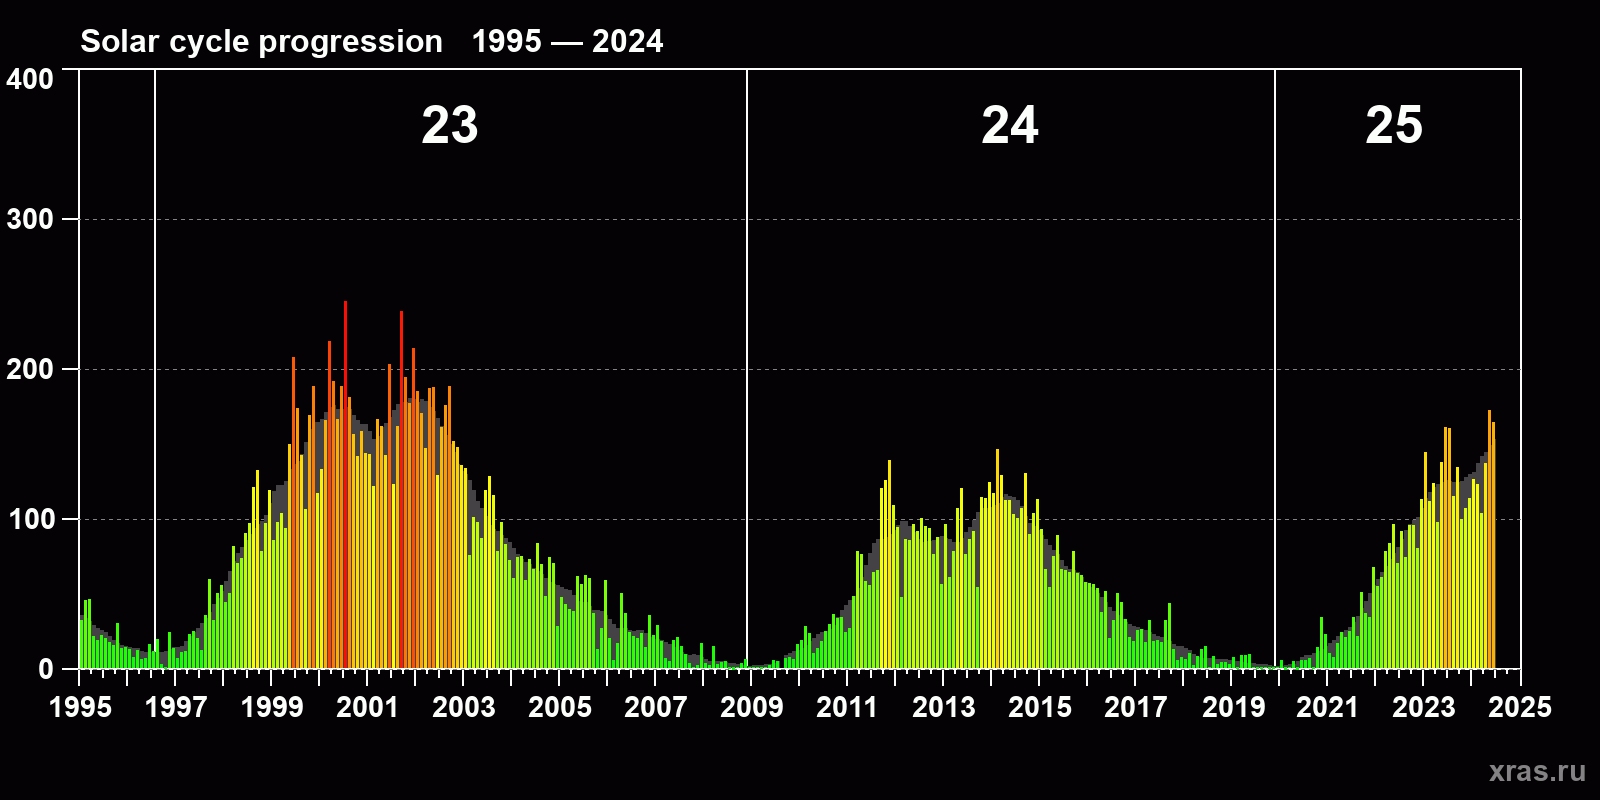
Solar cycle progression
Average monthly sunspot number (SSN) from 1995, January to 2024, June. Gray background - average solar cycle.