Solar wind parameters
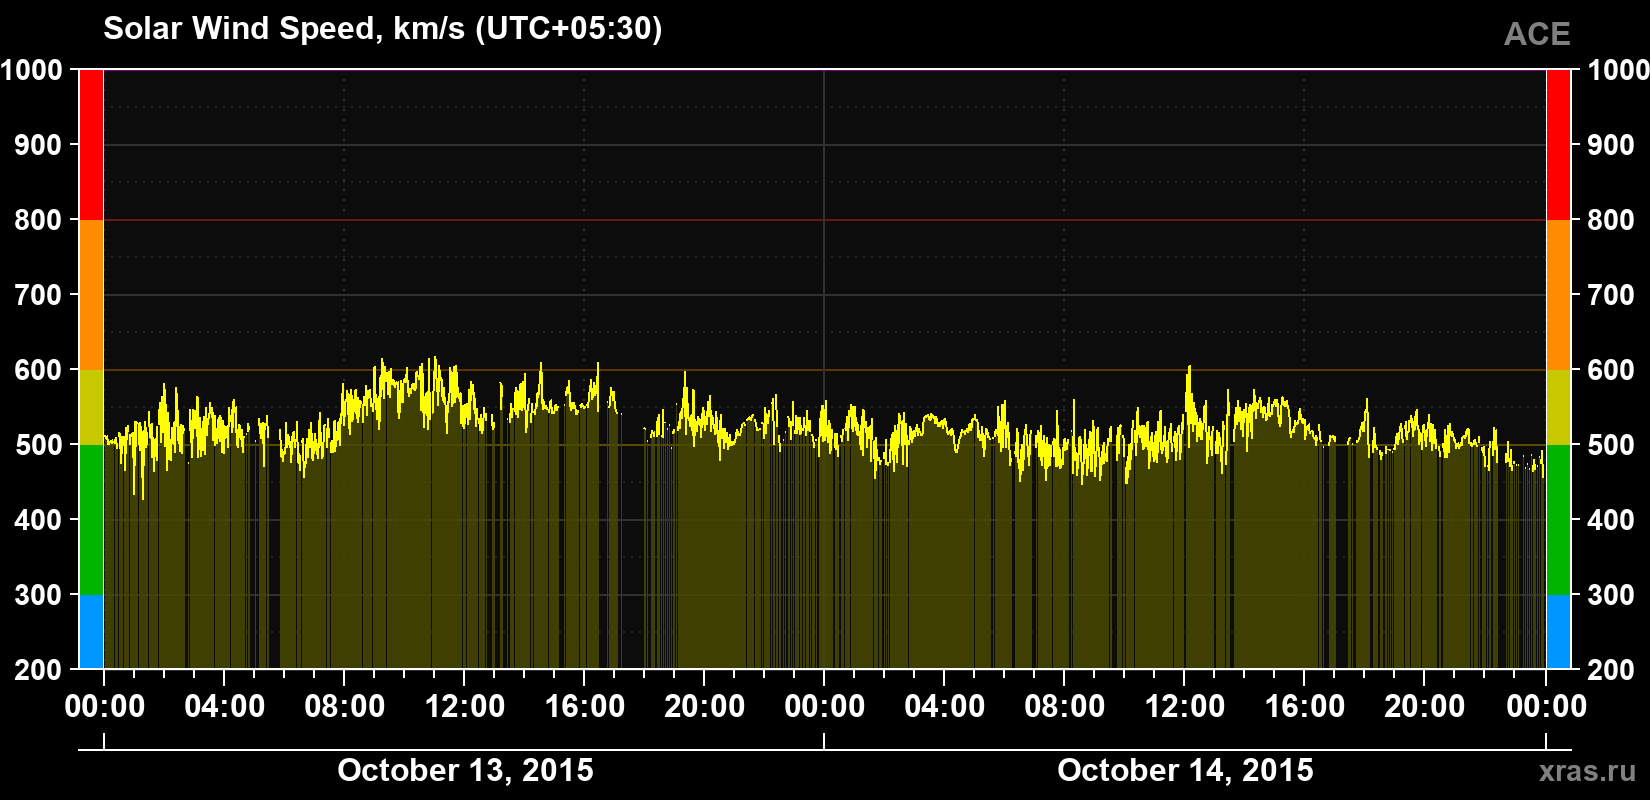
Solar wind speed
512 km/s
increased
(average for 24 hours)
Solar wind speed for October 13 and 14, 2015.
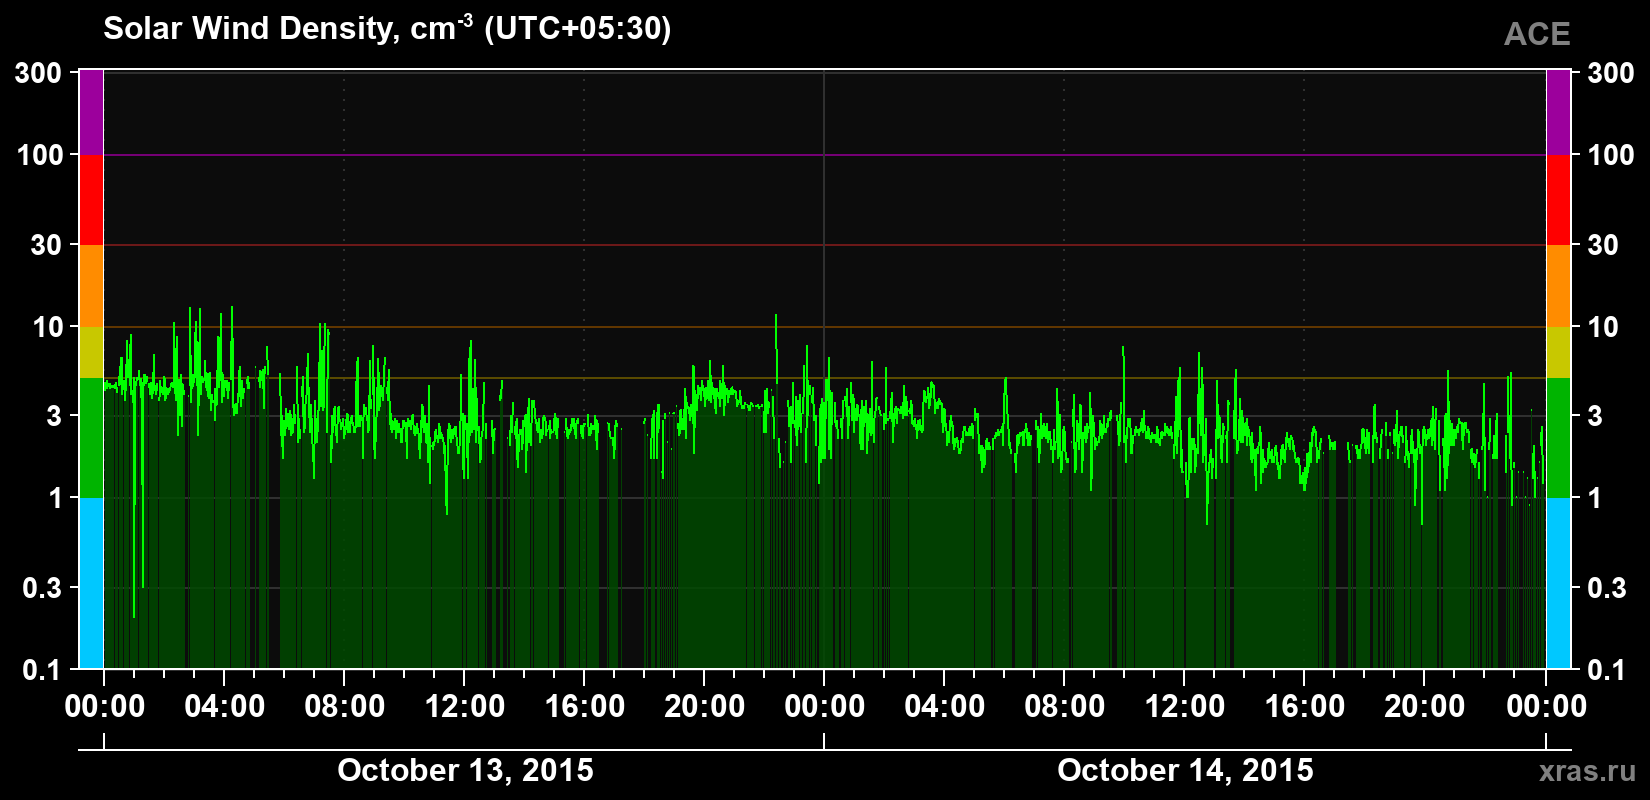
Solar wind density
2.3 cm-3
normal
(average for 24 hours)
Solar wind density for October 13 and 14, 2015.
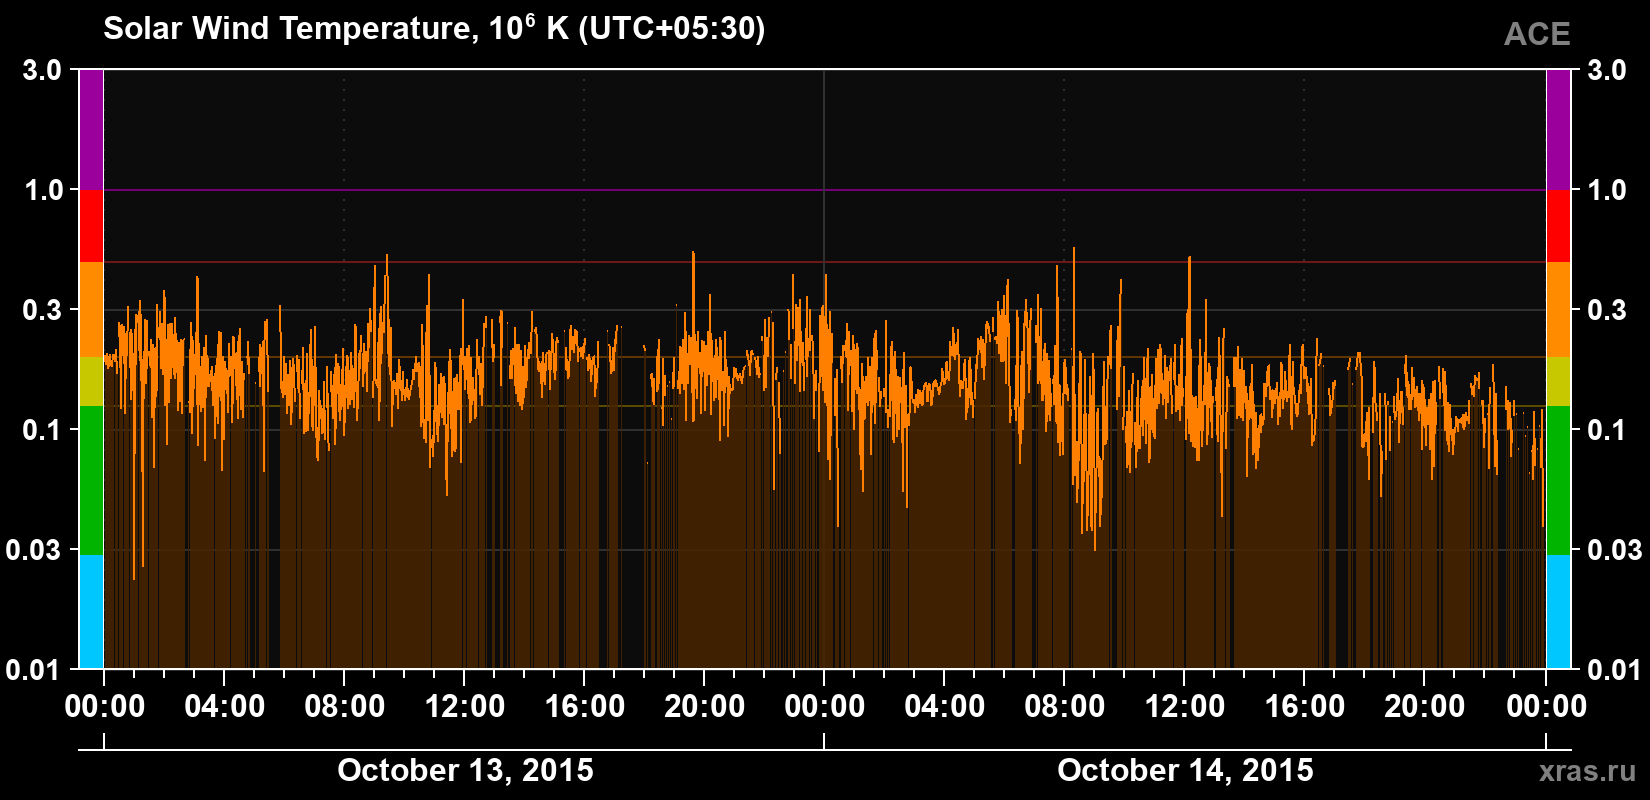
Solar wind temperature
143 000 K
increased
(average for 24 hours)
Solar wind temperature for October 13 and 14, 2015.
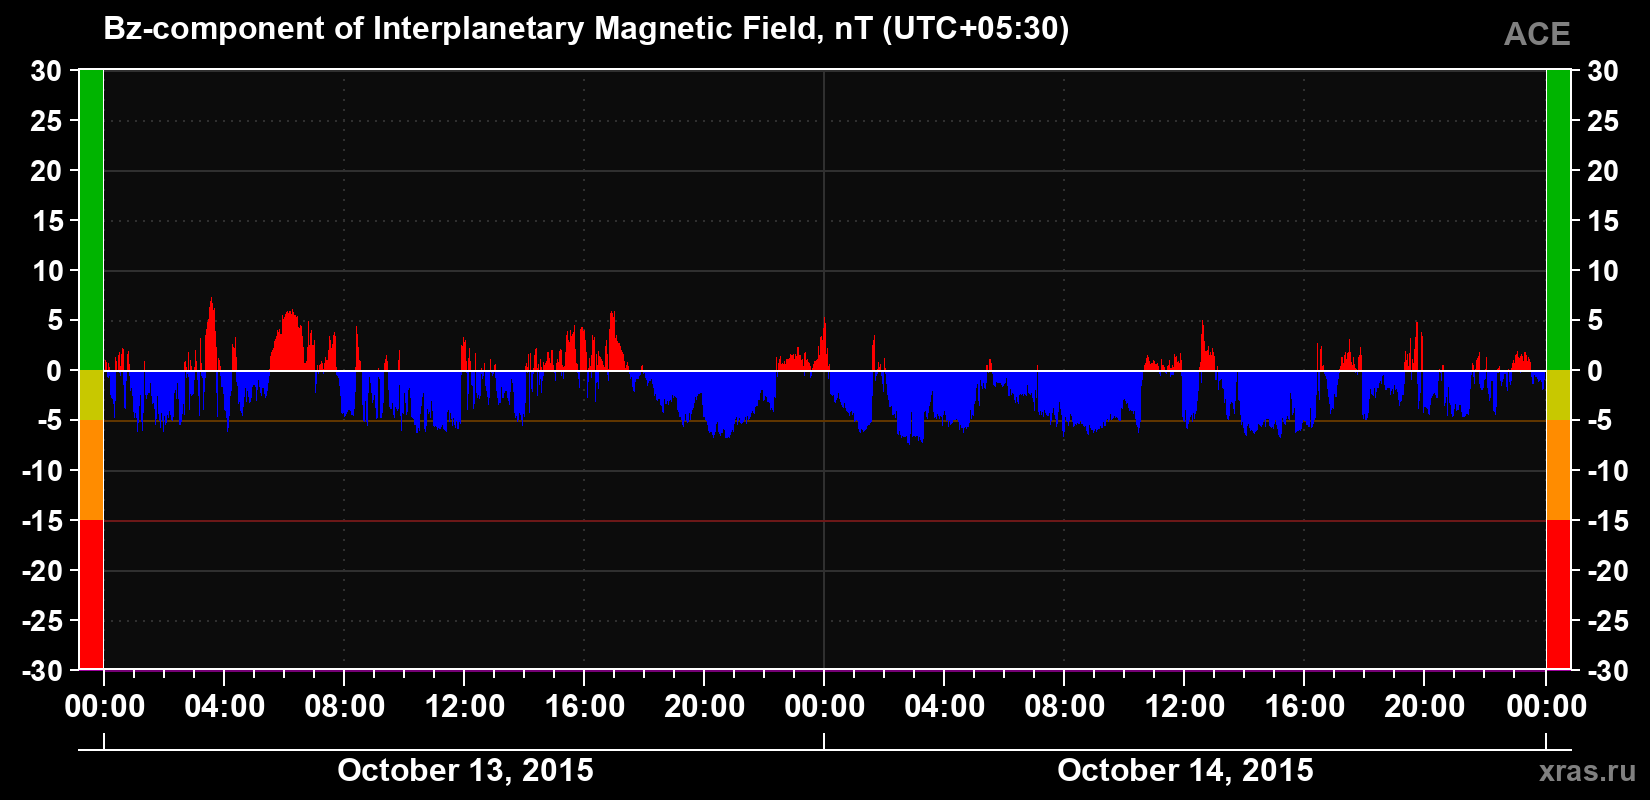
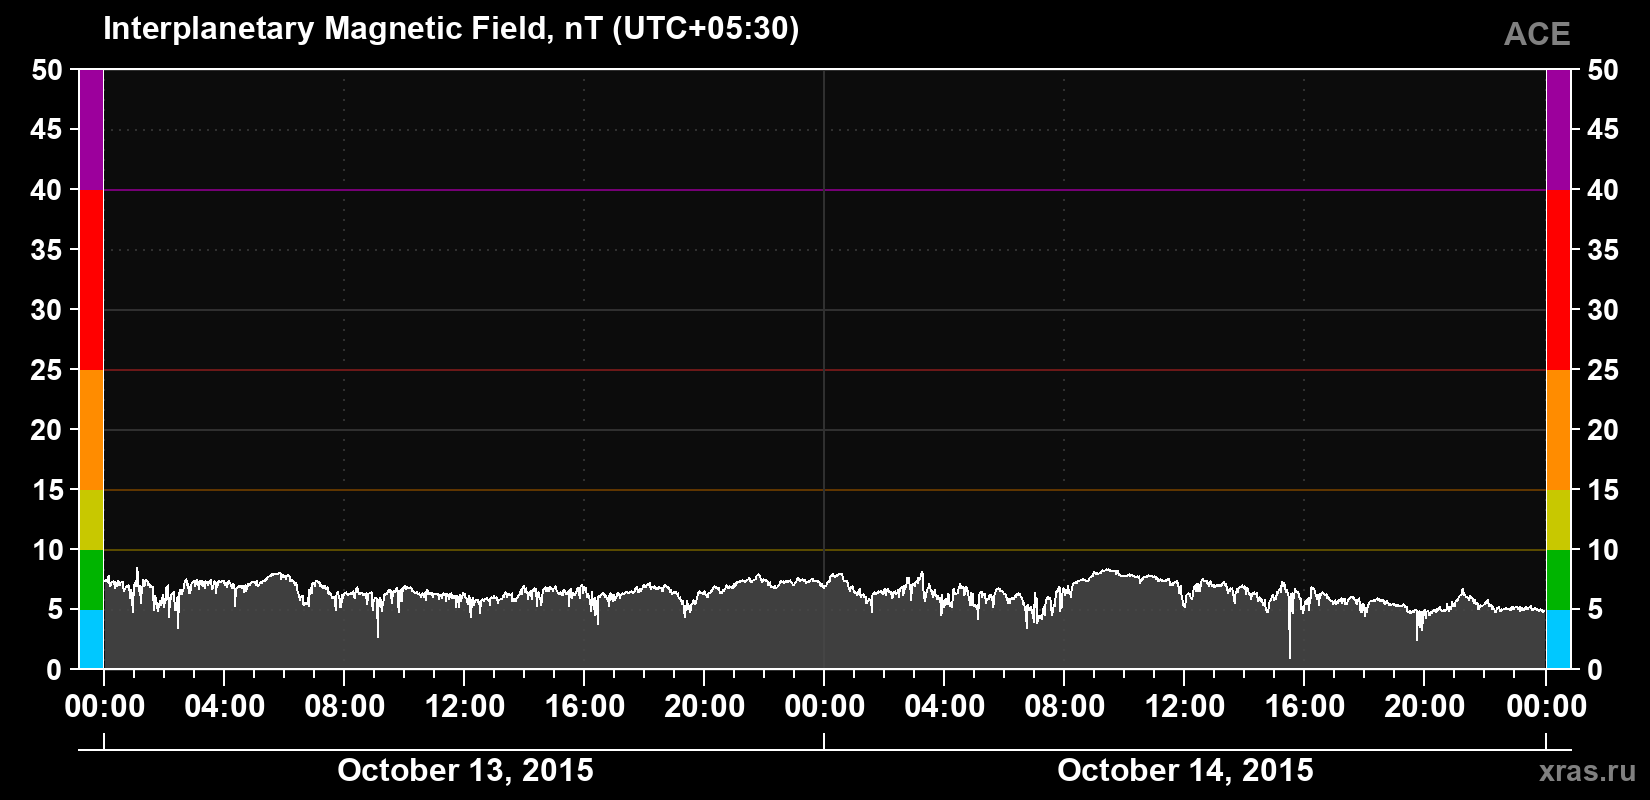
Solar wind magnetic field induction
6.2 nT
normal
(average for 24 hours)
Solar wind magnetic field induction for October 13 and 14, 2015.
The Bz component of the solar wind magnetic field
−2.8 nT
negative
(average for 24 hours)
The Bz component of the solar wind magnetic field for October 13 and 14, 2015.