Solar wind parameters
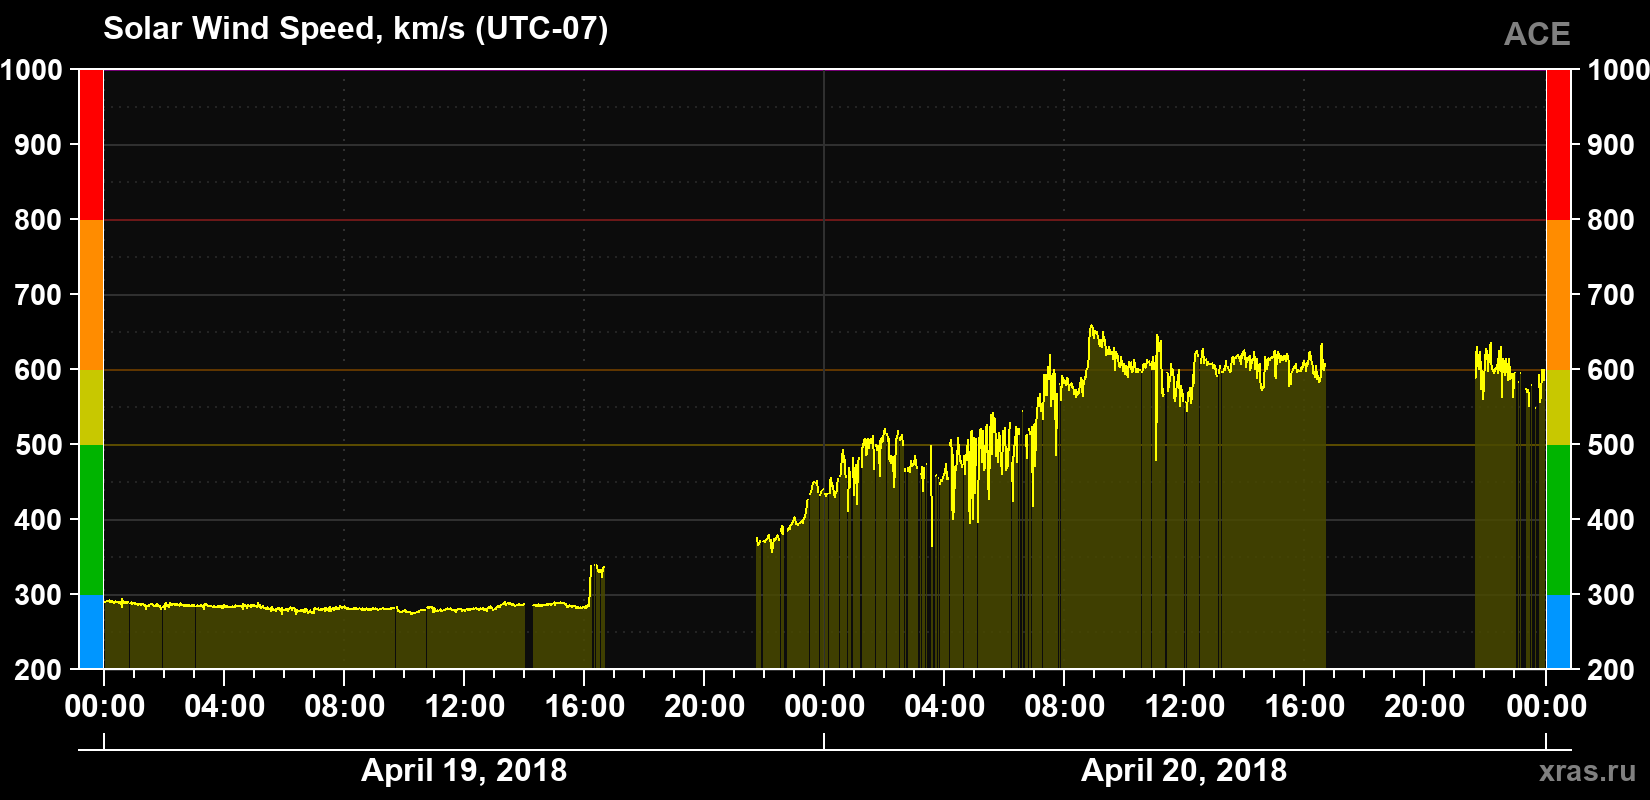
Solar wind speed
571 km/s
increased
(average for 24 hours)
Solar wind speed for April 19 and 20, 2018.
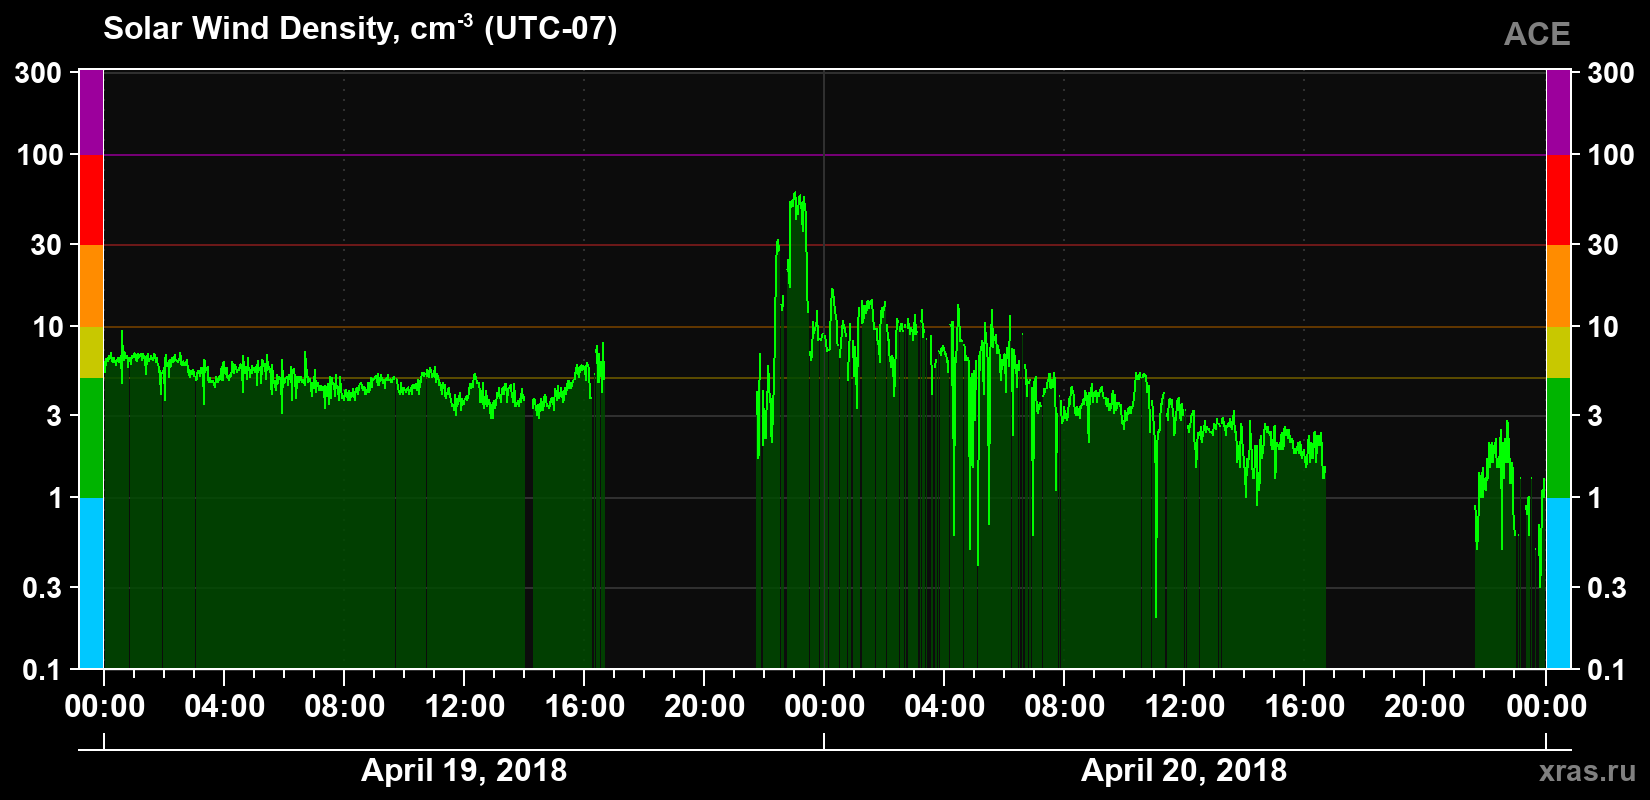
Solar wind density
4 cm-3
normal
(average for 24 hours)
Solar wind density for April 19 and 20, 2018.
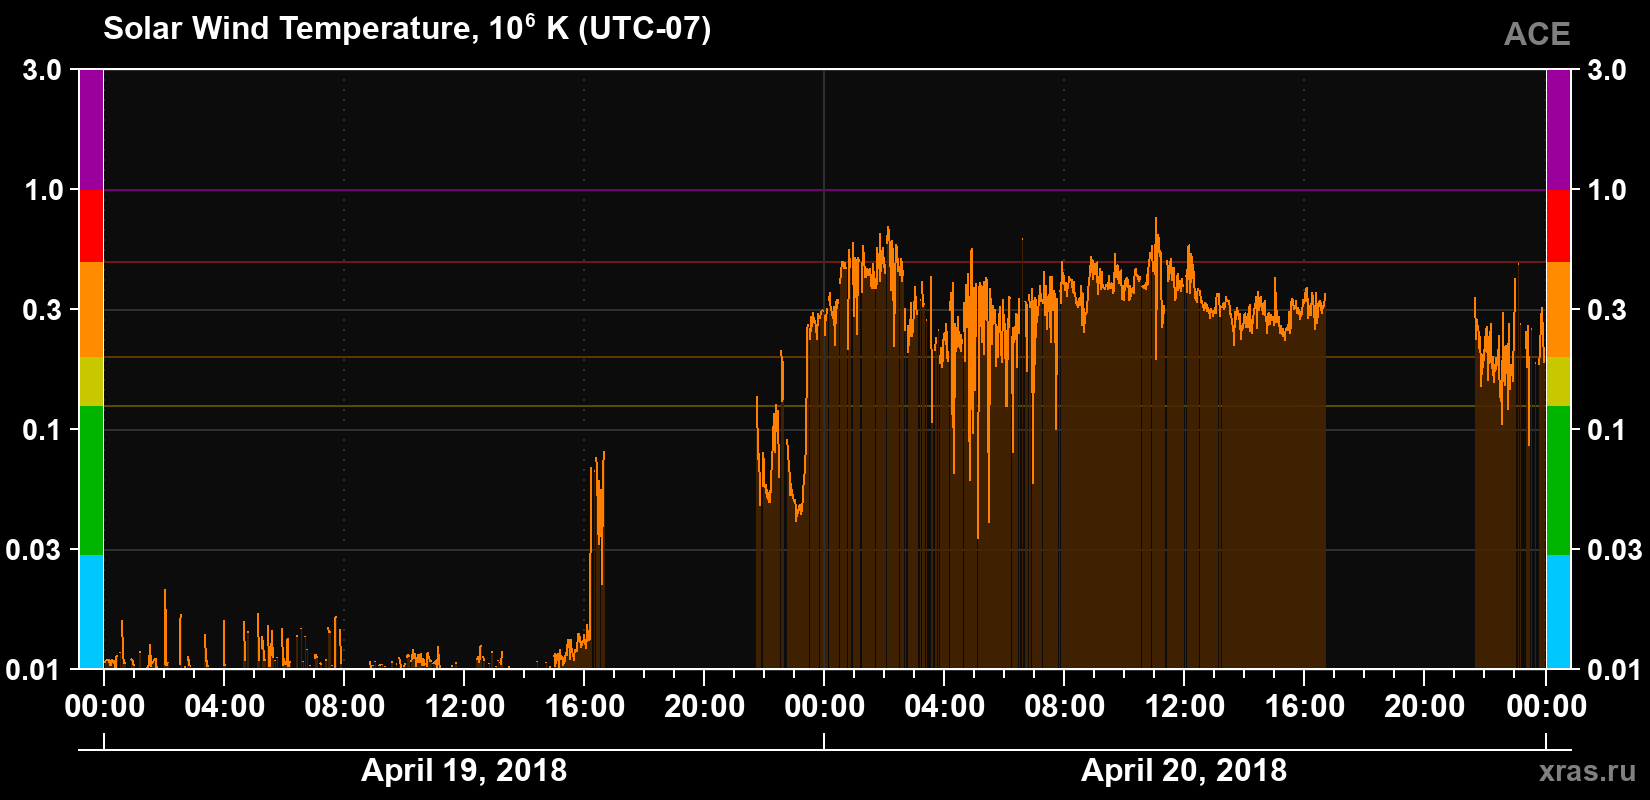
Solar wind temperature
340 000 K
high
(average for 24 hours)
Solar wind temperature for April 19 and 20, 2018.
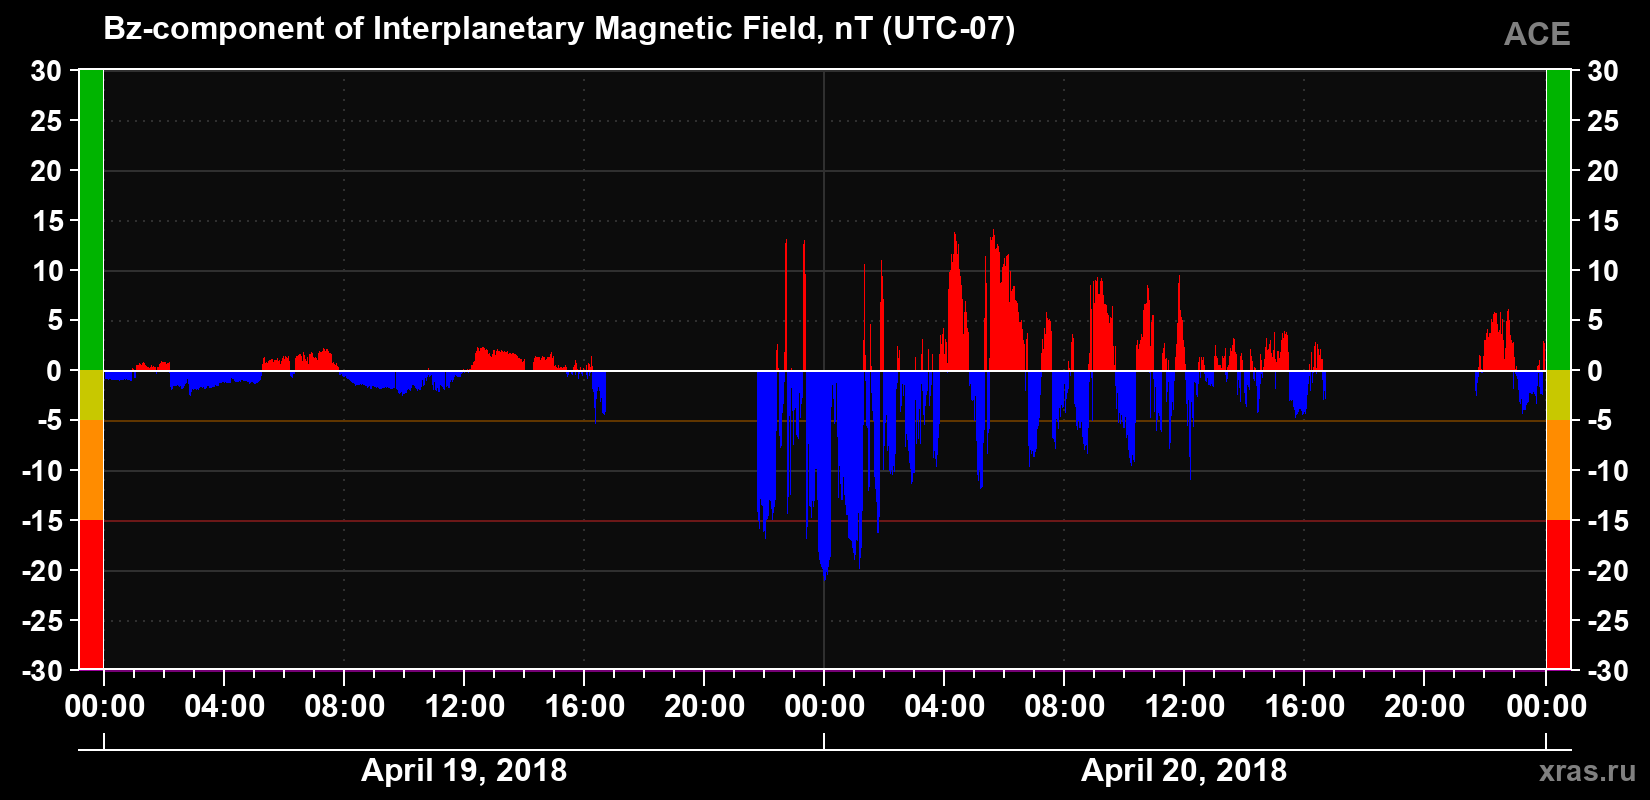
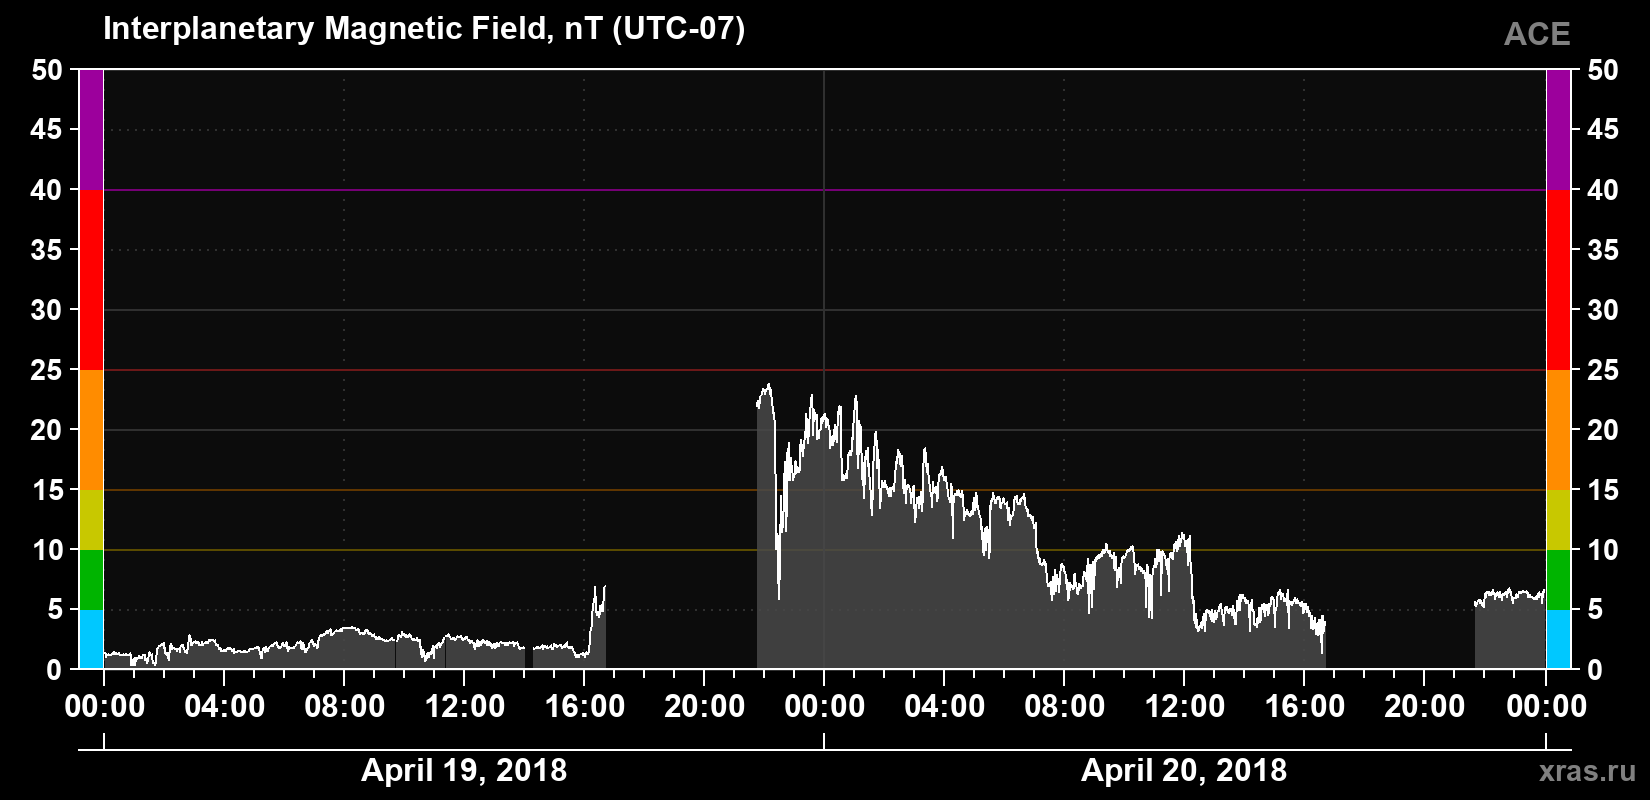
Solar wind magnetic field induction
9.8 nT
normal
(average for 24 hours)
Solar wind magnetic field induction for April 19 and 20, 2018.
The Bz component of the solar wind magnetic field
−0.4 nT
negative
(average for 24 hours)
The Bz component of the solar wind magnetic field for April 19 and 20, 2018.