Solar wind parameters
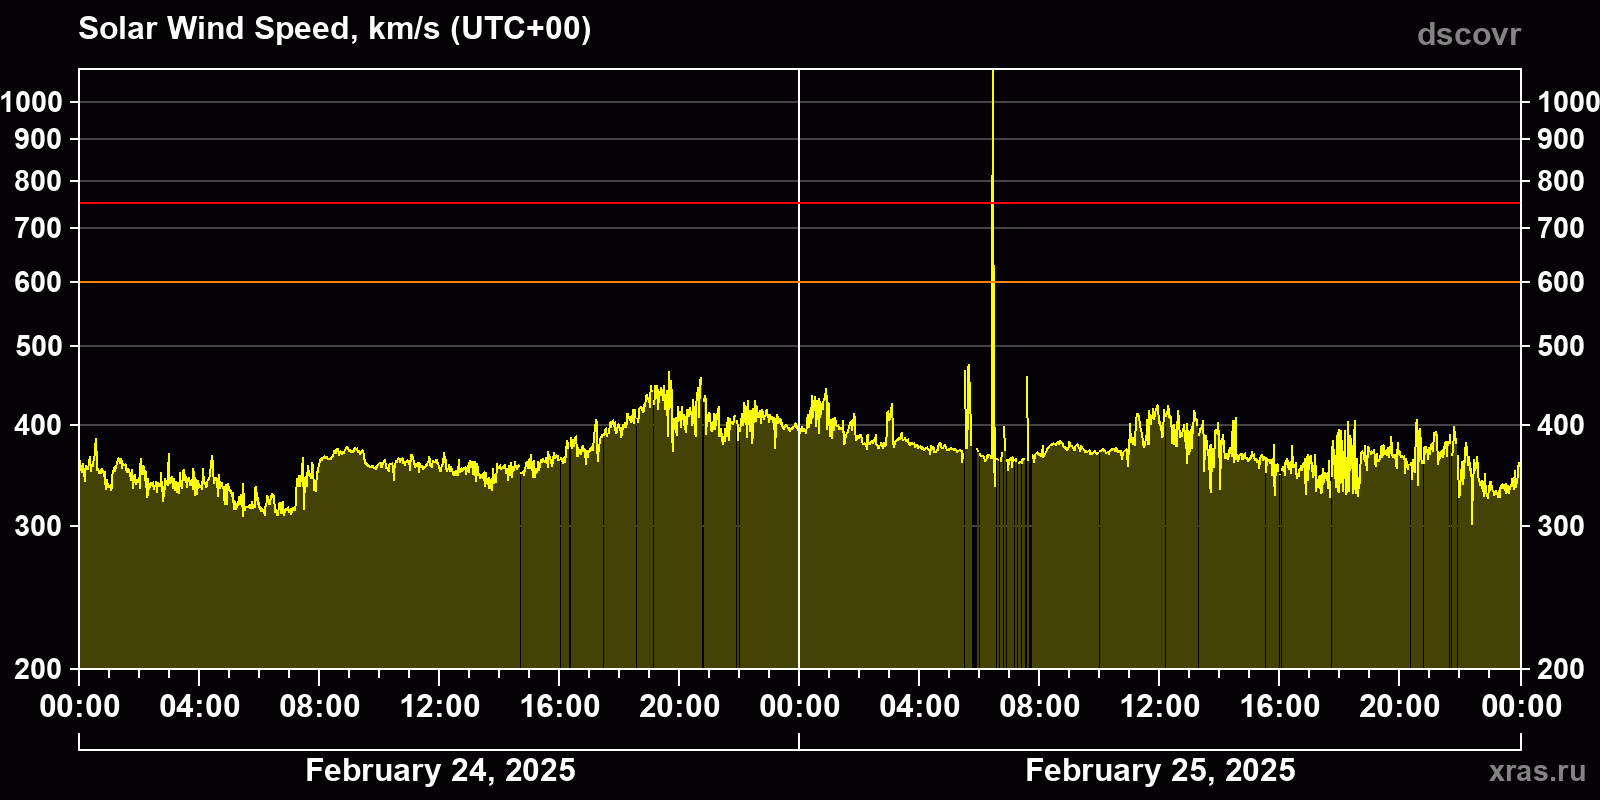
Solar wind speed
374 km/s
normal
(average for 24 hours)
Solar wind speed for February 24 and 25, 2025.
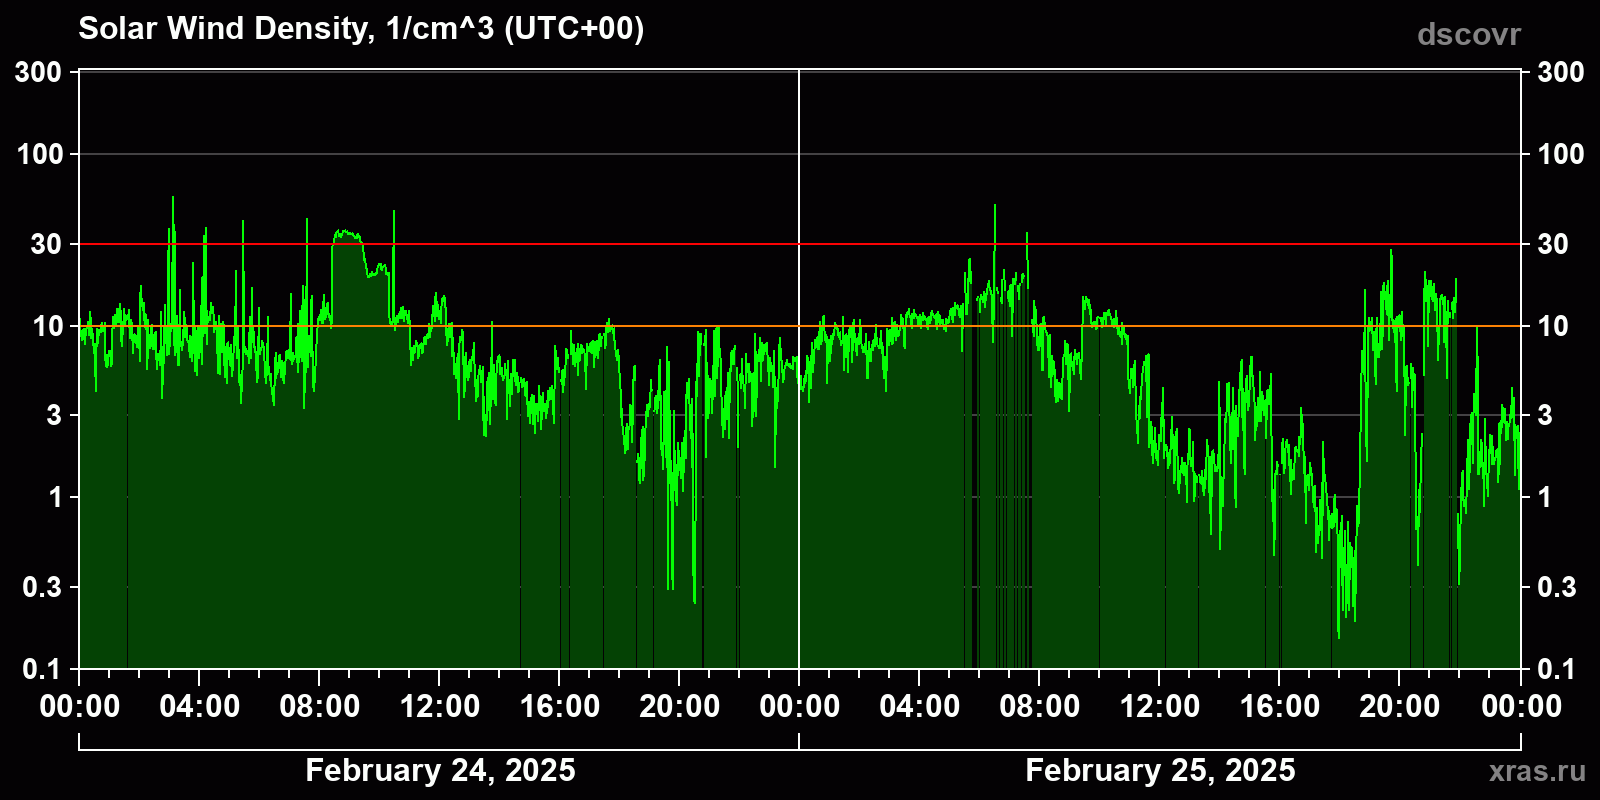
Solar wind density
7.1 cm-3
increased
(average for 24 hours)
Solar wind density for February 24 and 25, 2025.
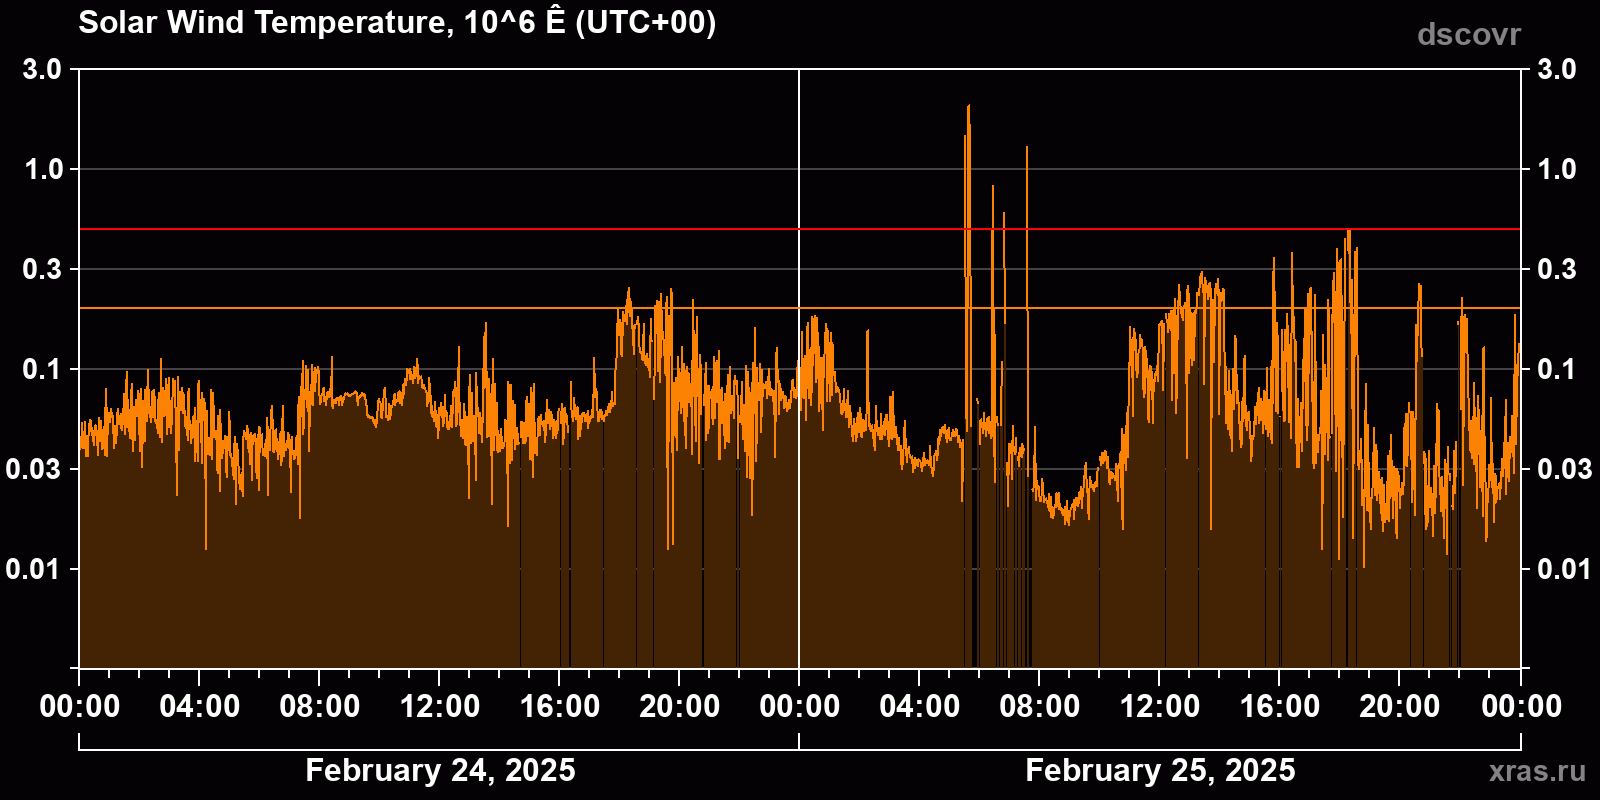
Solar wind temperature
55 000 K
normal
(average for 24 hours)
Solar wind temperature for February 24 and 25, 2025.
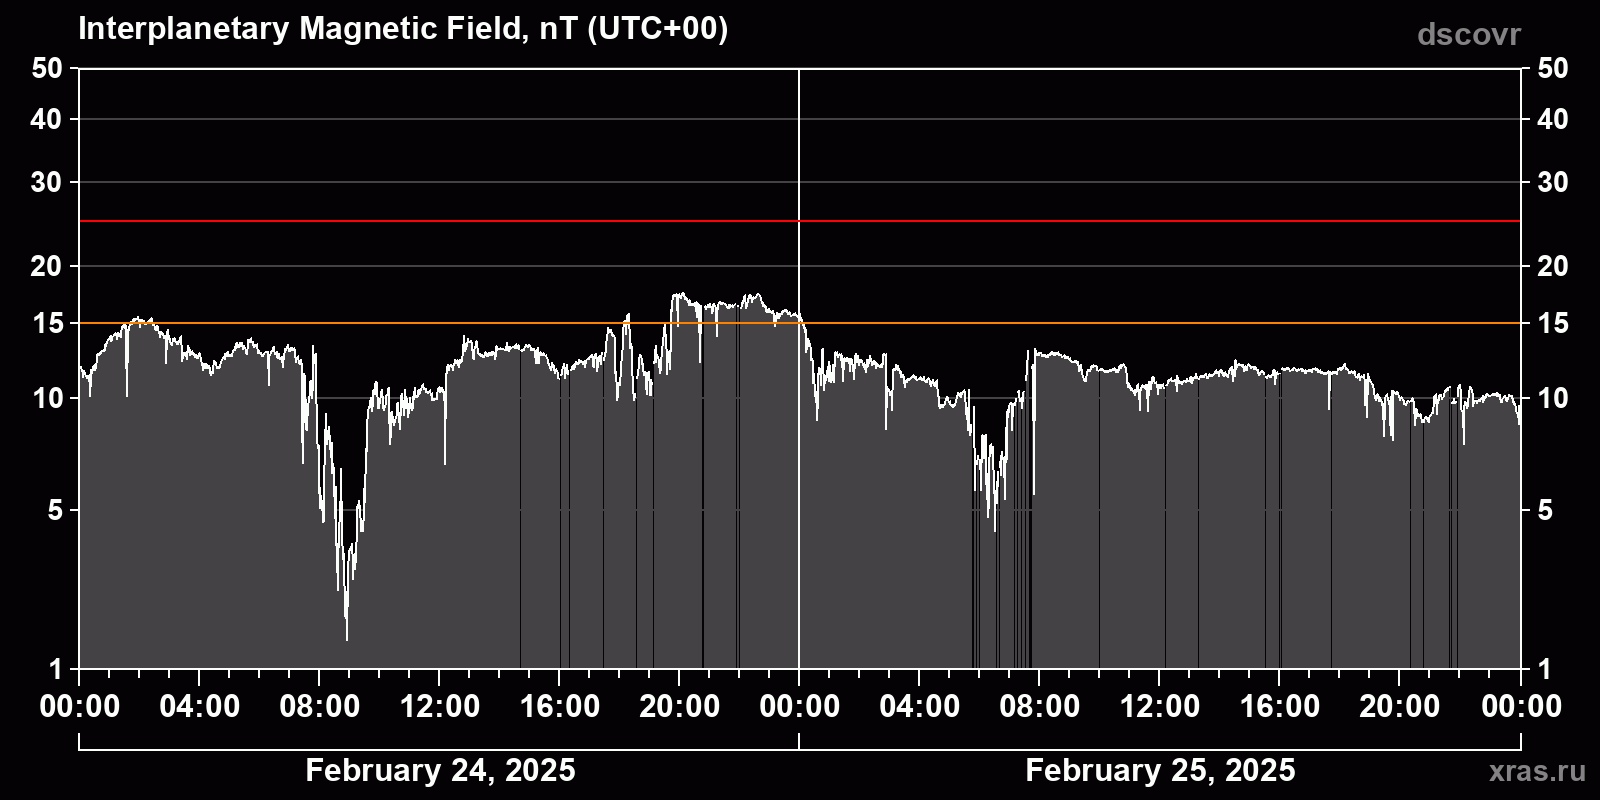
Solar wind magnetic field induction
11 nT
increased
(average for 24 hours)
Solar wind magnetic field induction for February 24 and 25, 2025.
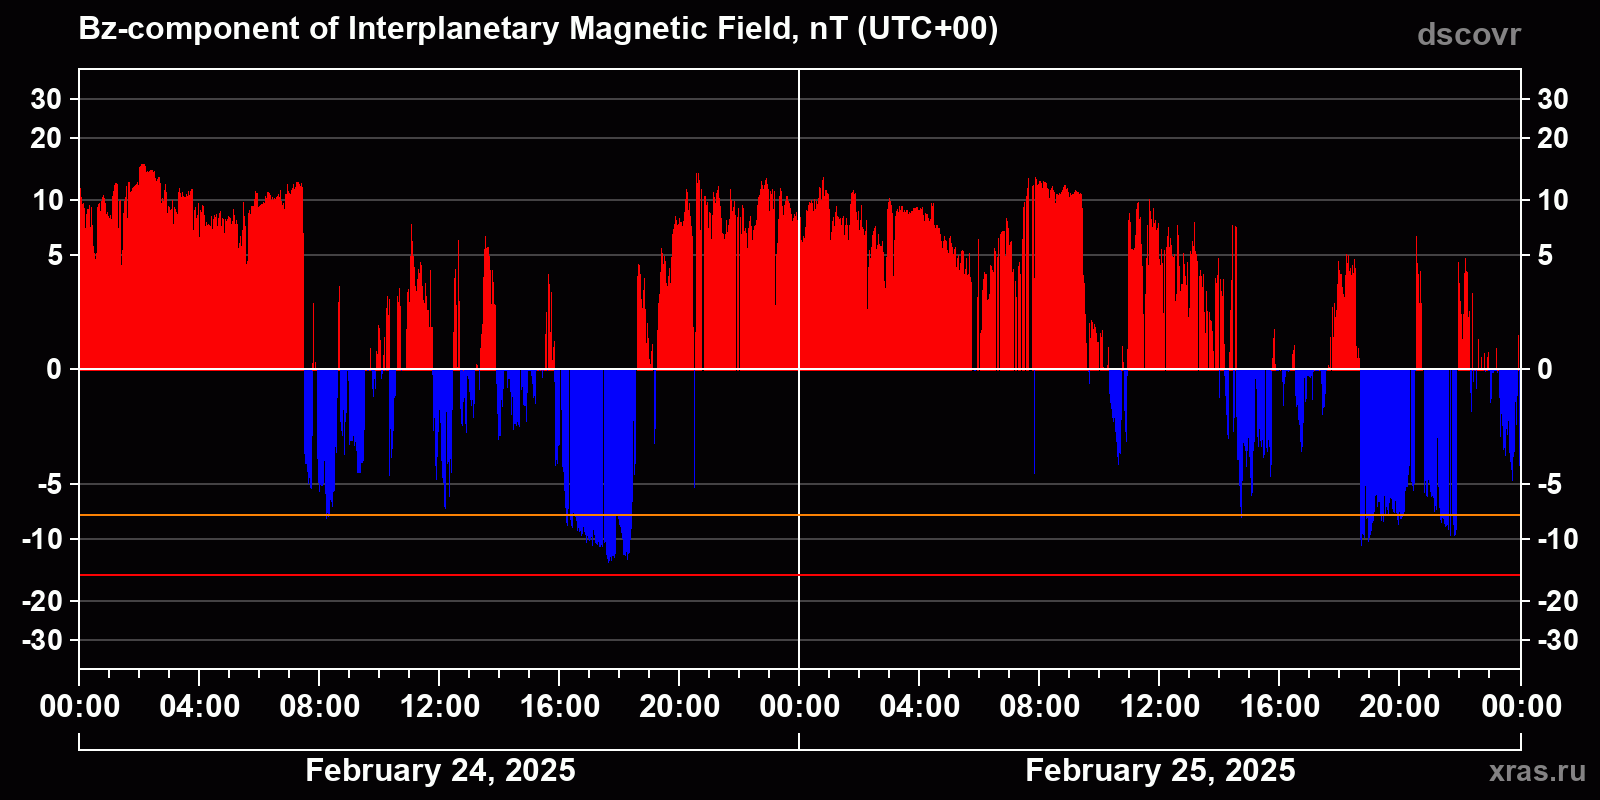
The Bz component of the solar wind magnetic field
+3.1 nT
positive
(average for 24 hours)
The Bz component of the solar wind magnetic field for February 24 and 25, 2025.