

Active areas
Sunspots and active regions
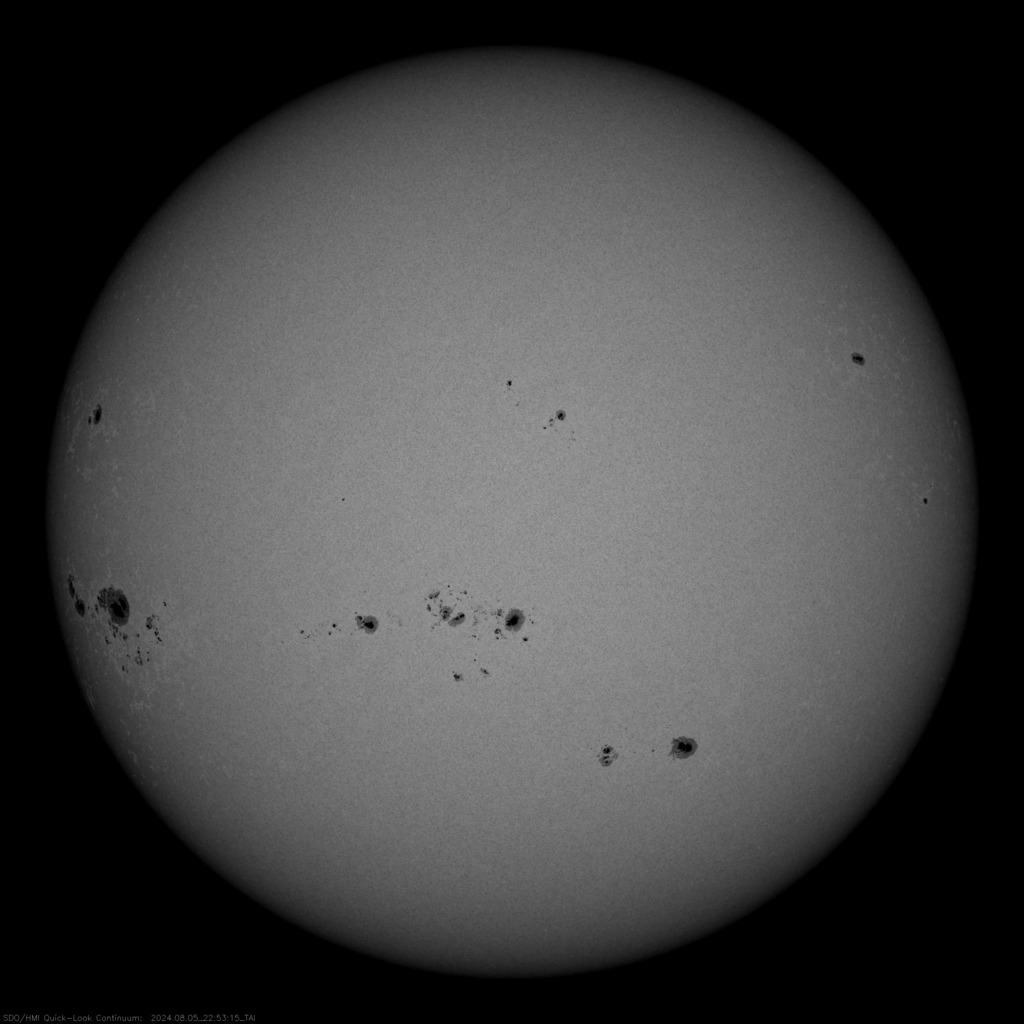
By the end of the day, the following active regions with sunspots could be observed on the Sun's surface
| Group ID | Location | Number of sunspots | Area (msh) | Type | CM Passage | Disappearance (W90) | Reappearance (W270) | |
|---|---|---|---|---|---|---|---|---|
| № 3777 | S09 | E49 | 07 | 0020 | Beta | Aug 9, 2024 | Aug 15, 2024 | Aug 29, 2024 |
| № 3776 | N10 | E07 | 01 | 0010 | Alpha | Aug 5, 2024 | Aug 12, 2024 | Aug 26, 2024 |
| № 3775 | N17 | E19 | 12 | 0120 | Beta-Gamma | Aug 6, 2024 | Aug 13, 2024 | Aug 27, 2024 |
| № 3774 | S05 | E28 | 19 | 0350 | Beta-Gamma | Aug 7, 2024 | Aug 14, 2024 | Aug 27, 2024 |
| № 3772 | S25 | E07 | 23 | 0380 | Beta-Gamma-Delta | Aug 5, 2024 | Aug 12, 2024 | Aug 26, 2024 |
| № 3770 | N07 | W74 | 05 | 0260 | Beta-Delta | Jul 30, 2024 | Aug 6, 2024 | Aug 20, 2024 |
| № 3769 | N22 | W28 | 01 | 0100 | Alpha | Aug 3, 2024 | Aug 10, 2024 | Aug 24, 2024 |
| № 3767 | S09 | W64 | 13 | 0200 | Beta-Gamma | Jul 31, 2024 | Aug 7, 2024 | Aug 20, 2024 |
| № 3766 | S07 | W82 | 07 | 0160 | Beta-Gamma | Jul 30, 2024 | Aug 6, 2024 | Aug 19, 2024 |
| № 3765 | S11 | W75 | 07 | 0140 | Beta-Gamma | Jul 30, 2024 | Aug 6, 2024 | Aug 20, 2024 |
| № 3764 | S03 | W89 | 01 | 0040 | Alpha | Jul 29, 2024 | Aug 5, 2024 | Aug 19, 2024 |
| № 3763 | N05 | W90 | 01 | 0060 | Alpha | Jul 29, 2024 | Aug 5, 2024 | Aug 18, 2024 |
Solar cycle progression
Average monthly sunspot number (SSN) from 1995, January to 2024, August. Gray background - average solar cycle.
