Active areas
Sunspots and active regions
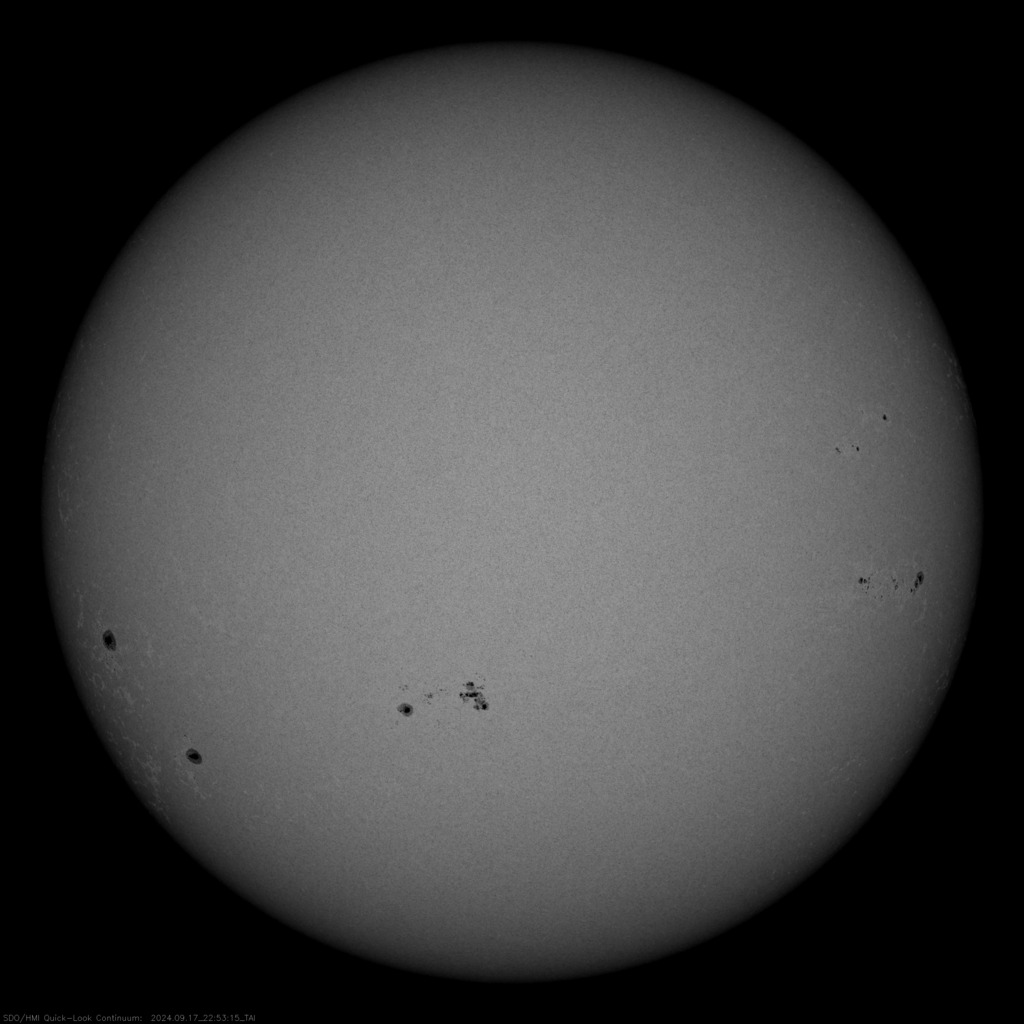
The following regions with sunspots can be now observed on the Sun's surface
| Group number | Sunspots Location on the Sun | The number of spots in the group | The classification by the Zurich's modified system | Area (millions of shares of the solar hemisphere) | Group length (in degrees) | Carrington Longitude (in degrees) | Group's magnet type |
| № 3828 | S13 E75 | 01 | hhx | 0120 |
03 | 041 | alpha |
| № 3827 | S28 E65 | 01 | hsx | 0120 |
03 | 031 | alpha |
| № 3826 | S26 W44 | 02 | bxo | 0010 |
04 | 077 | beta |
| № 3825 | S16 E20 | 13 | eai | 0180 |
12 | 013 | beta-gamma |
| № 3824 | S04 W40 | 13 | csi | 0070 |
12 | 073 | beta-gamma |
| № 3822 | N15 W71 | 01 | cro | 0030 |
02 | 104 | beta |
| № 3814 | N17 W84 | 02 | hsx | 0130 |
01 | 118 | alpha |
H-alpha plages without spots
The following H-alpha plages without spots can be currently observed on the Sun's surface
| Area number | Coordinates | Carrington Longitude (in degrees) |
| № 3817 | S14 W89 | 123 |

