

Solar wind on Feb 01, 2025
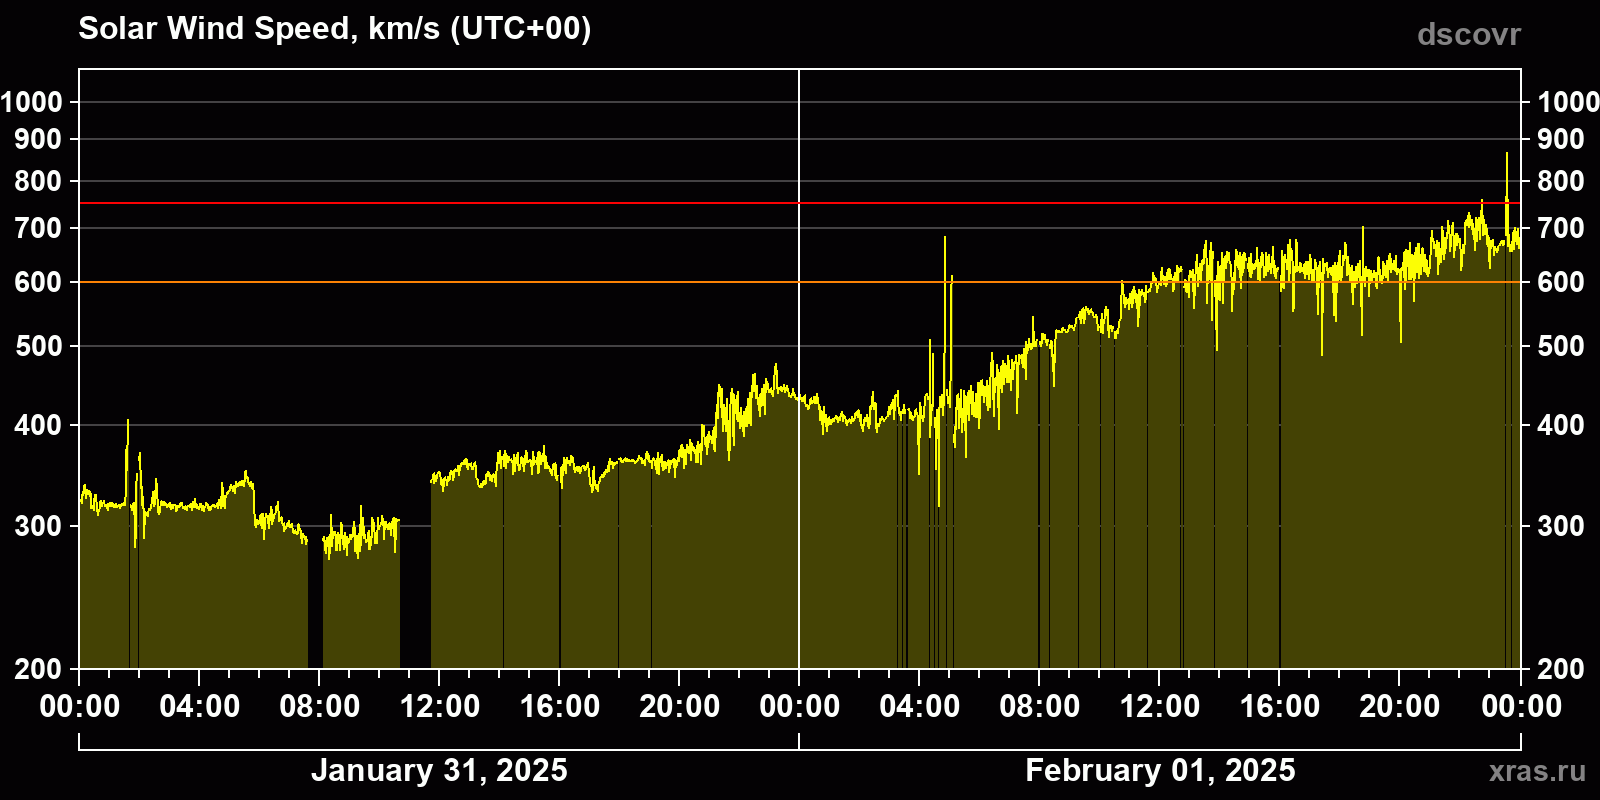
Solar wind speed
561 km/c
increased (average for 24 hours)
Dynamics for the Jan 31, 2025 and Feb 01, 2025 using dscovr spacecraft data
This chart in PNG format — high resolution
text data: JSON or TXT
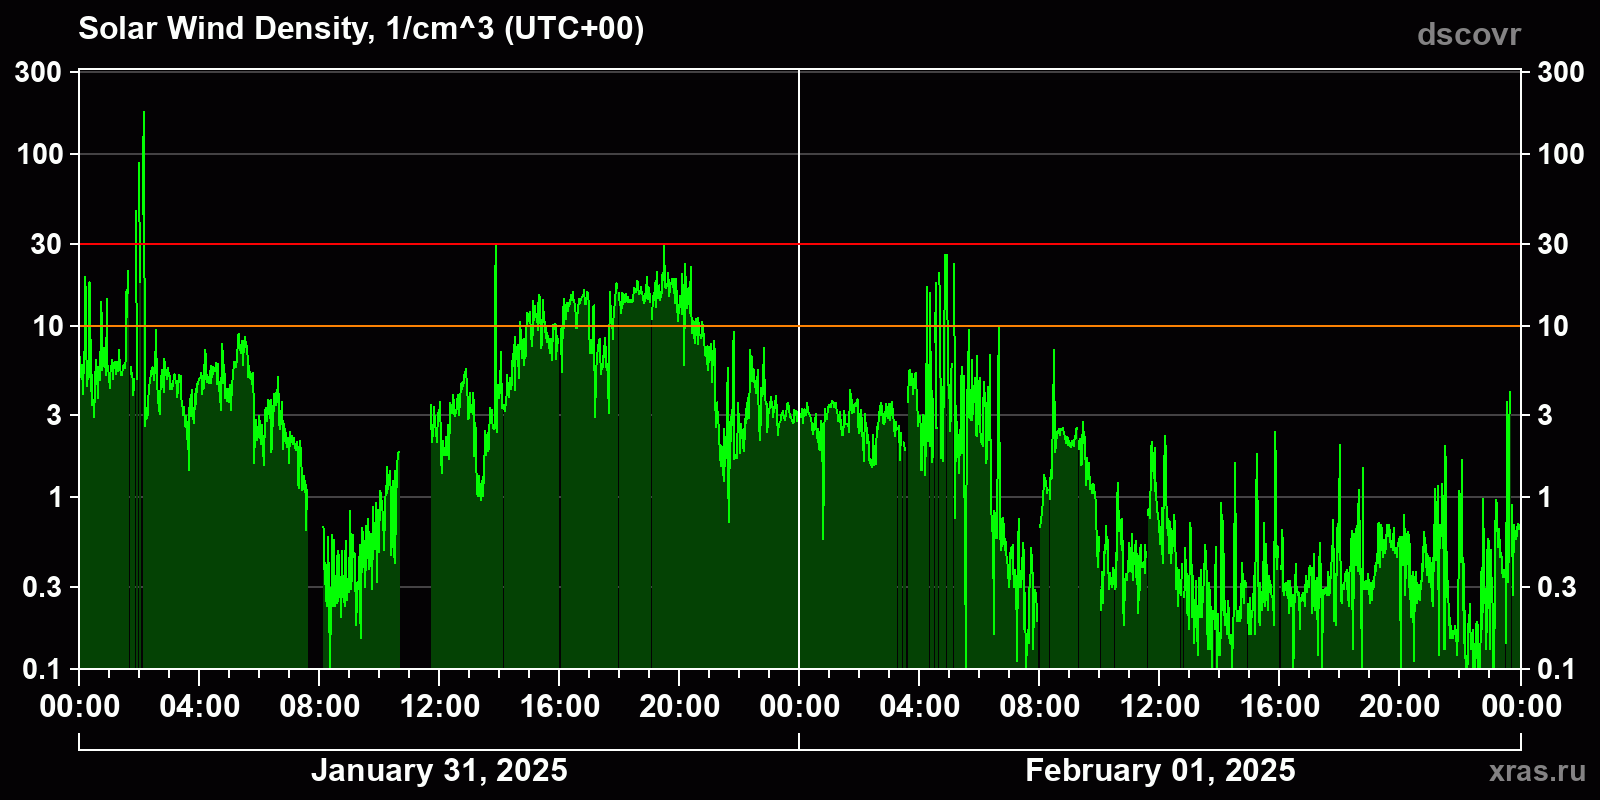
Solar wind density
1 cm-3
normal (average for 24 hours)
Dynamics for the Jan 31, 2025 and Feb 01, 2025 using dscovr spacecraft data
This chart in PNG format — high resolution
text data: JSON or TXT
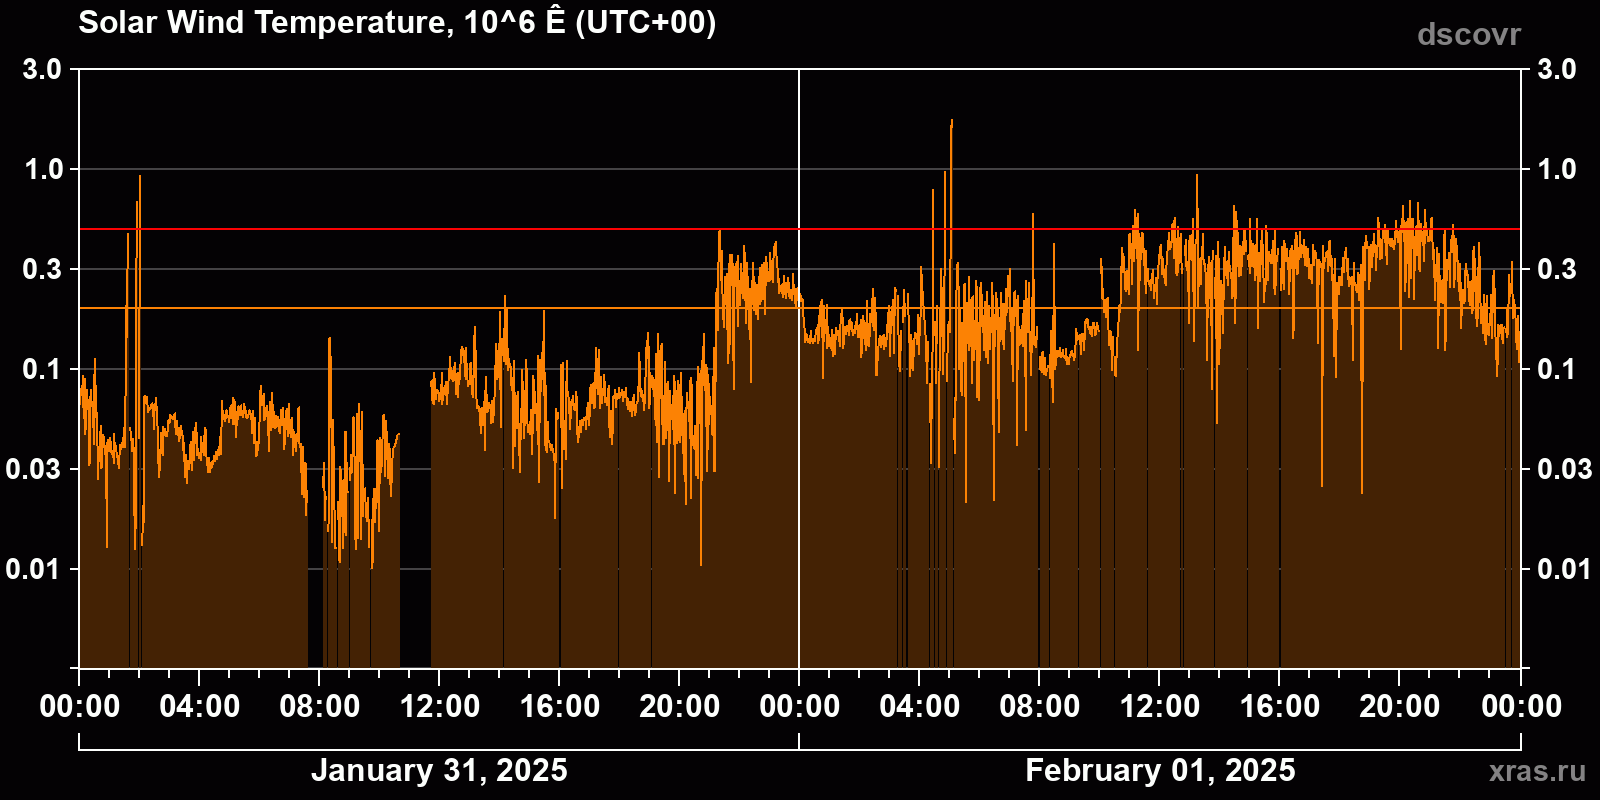
Solar wind temperature
256 000 K
high (average for 24 hours)
Dynamics for the Jan 31, 2025 and Feb 01, 2025 using dscovr spacecraft data
This chart in PNG format — high resolution
text data: JSON or TXT
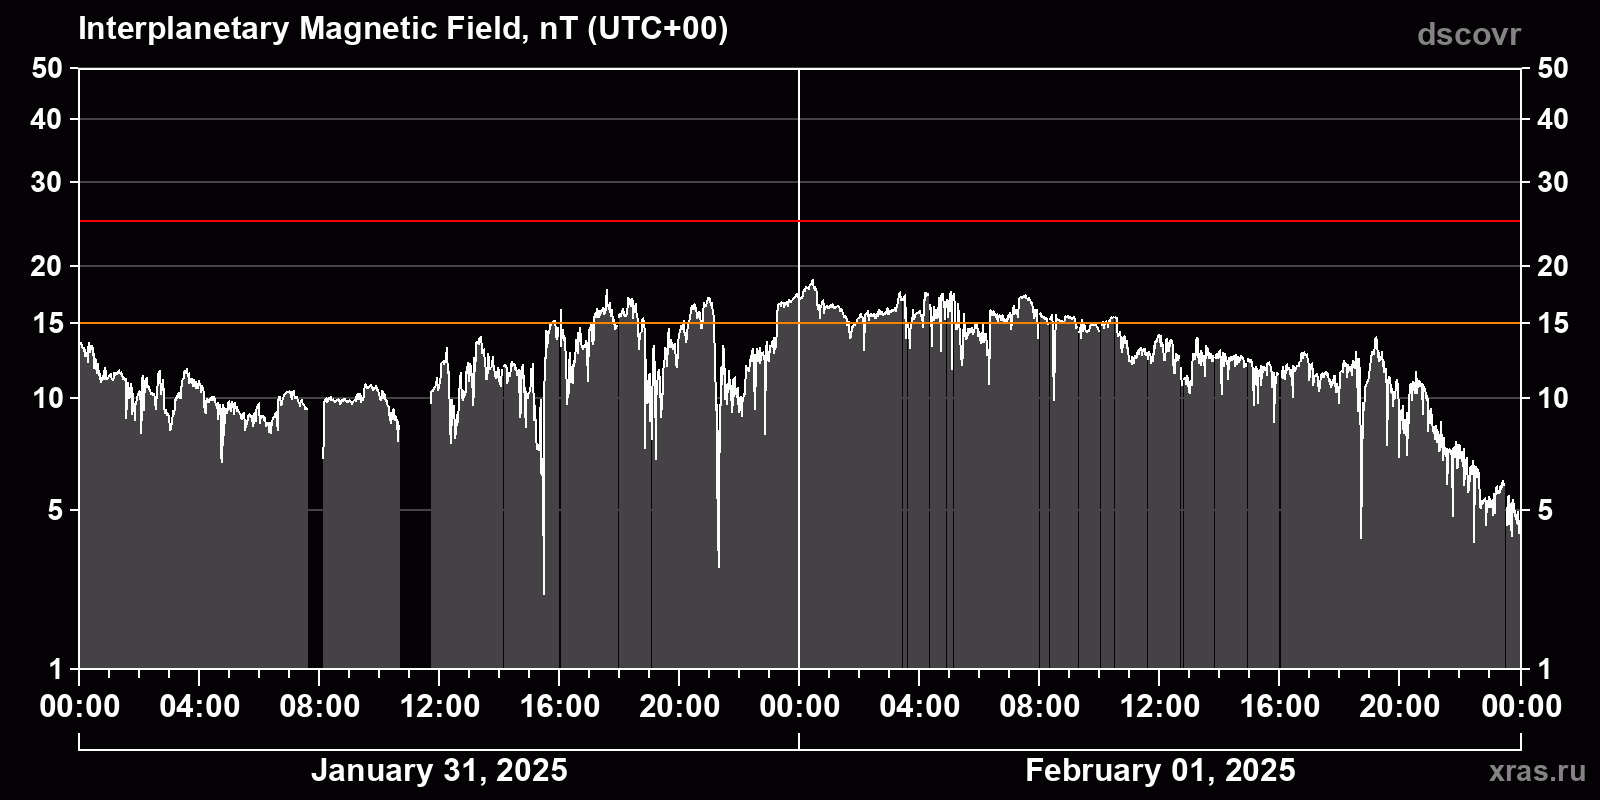
Interplanetary magnetic field induction
13.1 nT
increased (average for 24 hours)
Dynamics for the Jan 31, 2025 and Feb 01, 2025 using dscovr spacecraft data
This chart in PNG format — high resolution
text data: JSON or TXT
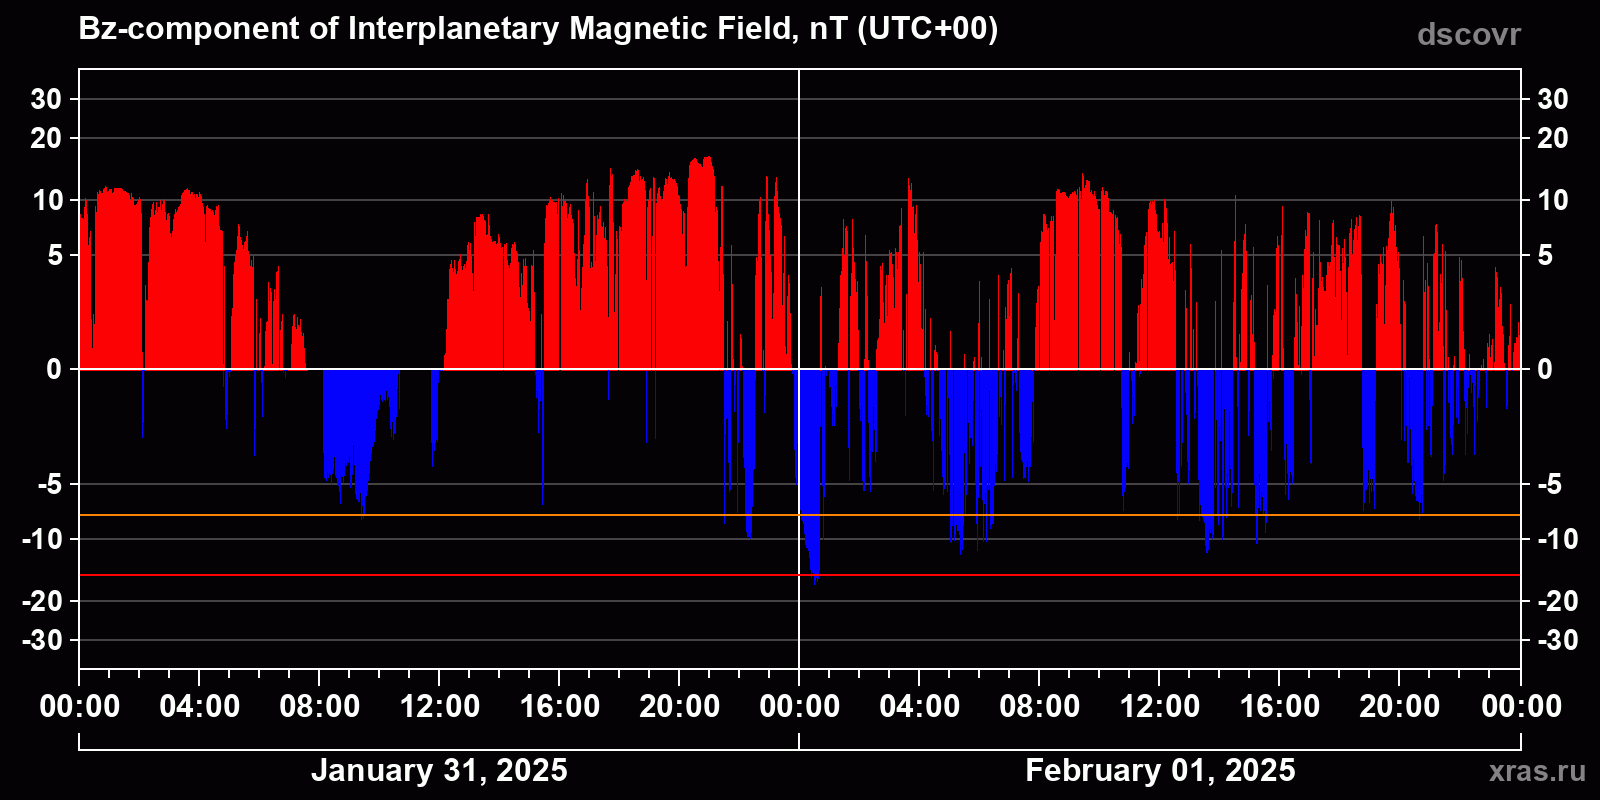
Component Bz of the interplanetary magnetic field
+1.2 nT
positive (average for 24 hours)
Dynamics for the Jan 31, 2025 and Feb 01, 2025 using dscovr spacecraft data
This chart in PNG format — high resolution
text data: JSON or TXT