Solar wind parameters
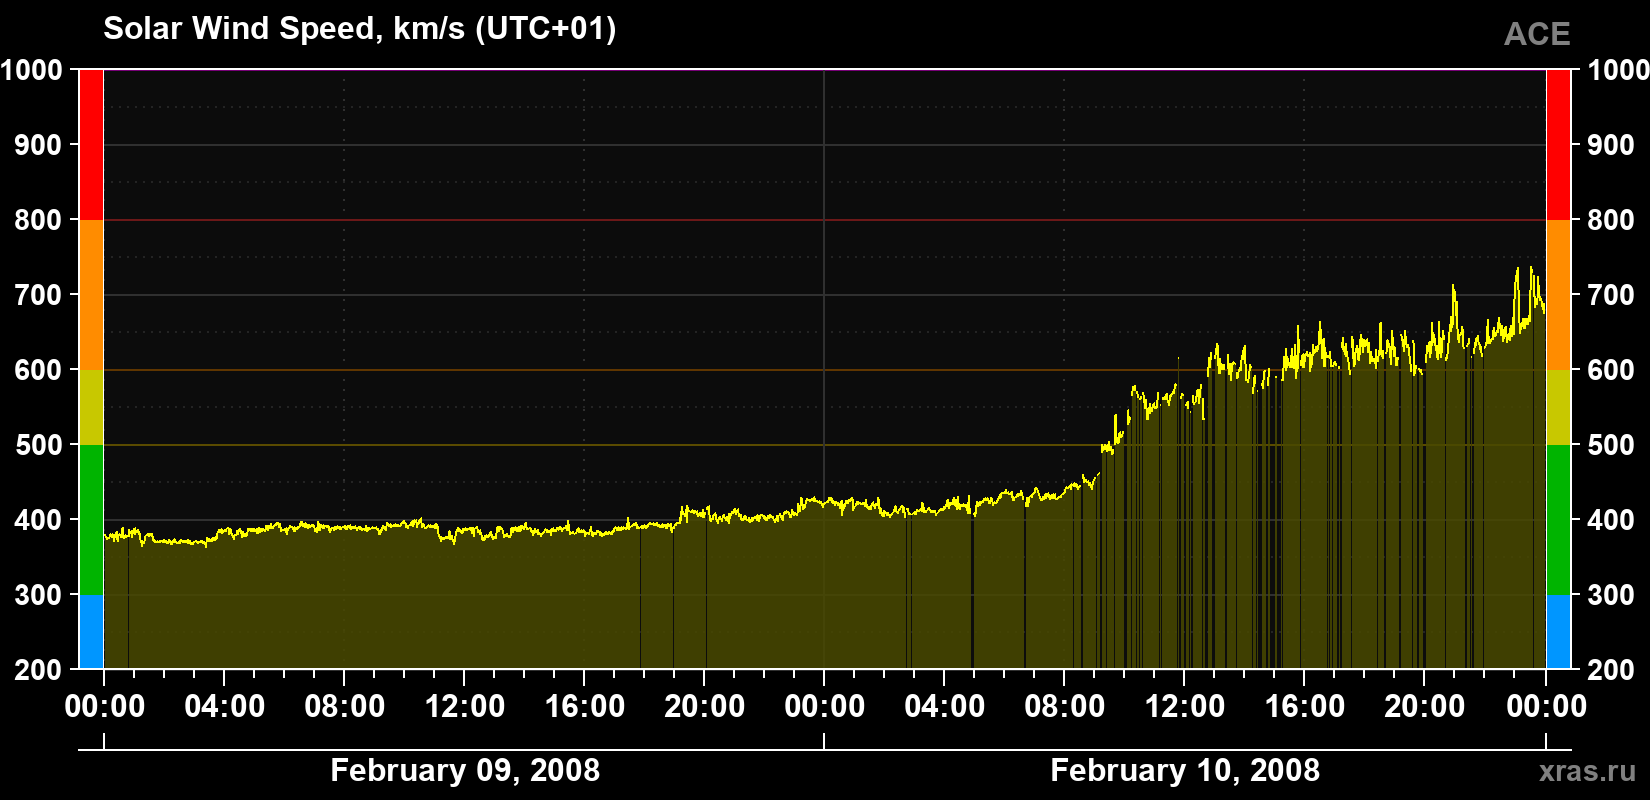
Solar wind speed
528 km/s
increased
(average for 24 hours)
Solar wind speed for February 9 and 10, 2008.
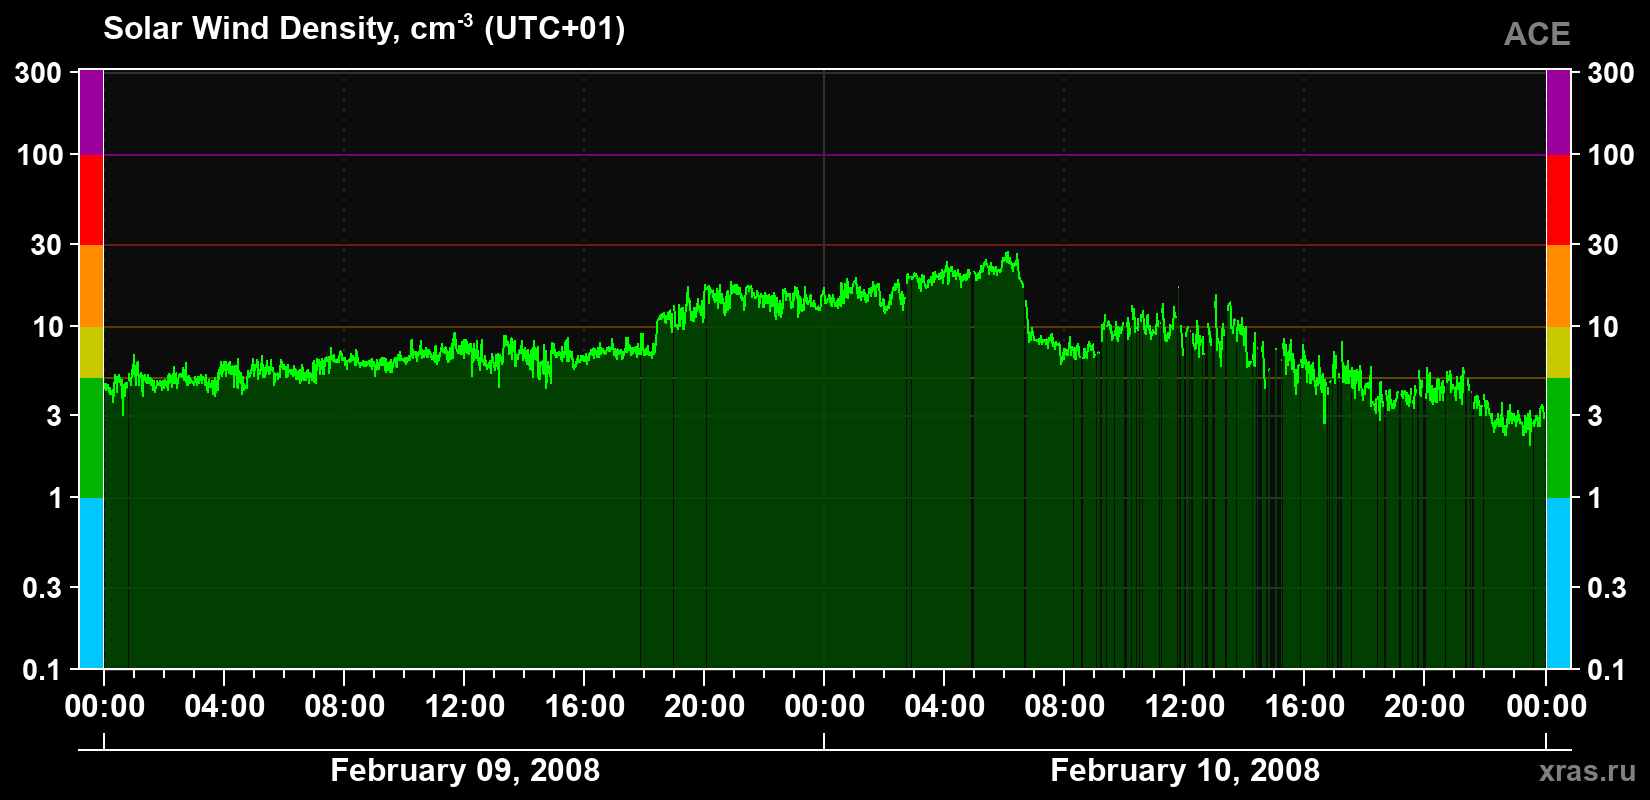
Solar wind density
9.9 cm-3
increased
(average for 24 hours)
Solar wind density for February 9 and 10, 2008.
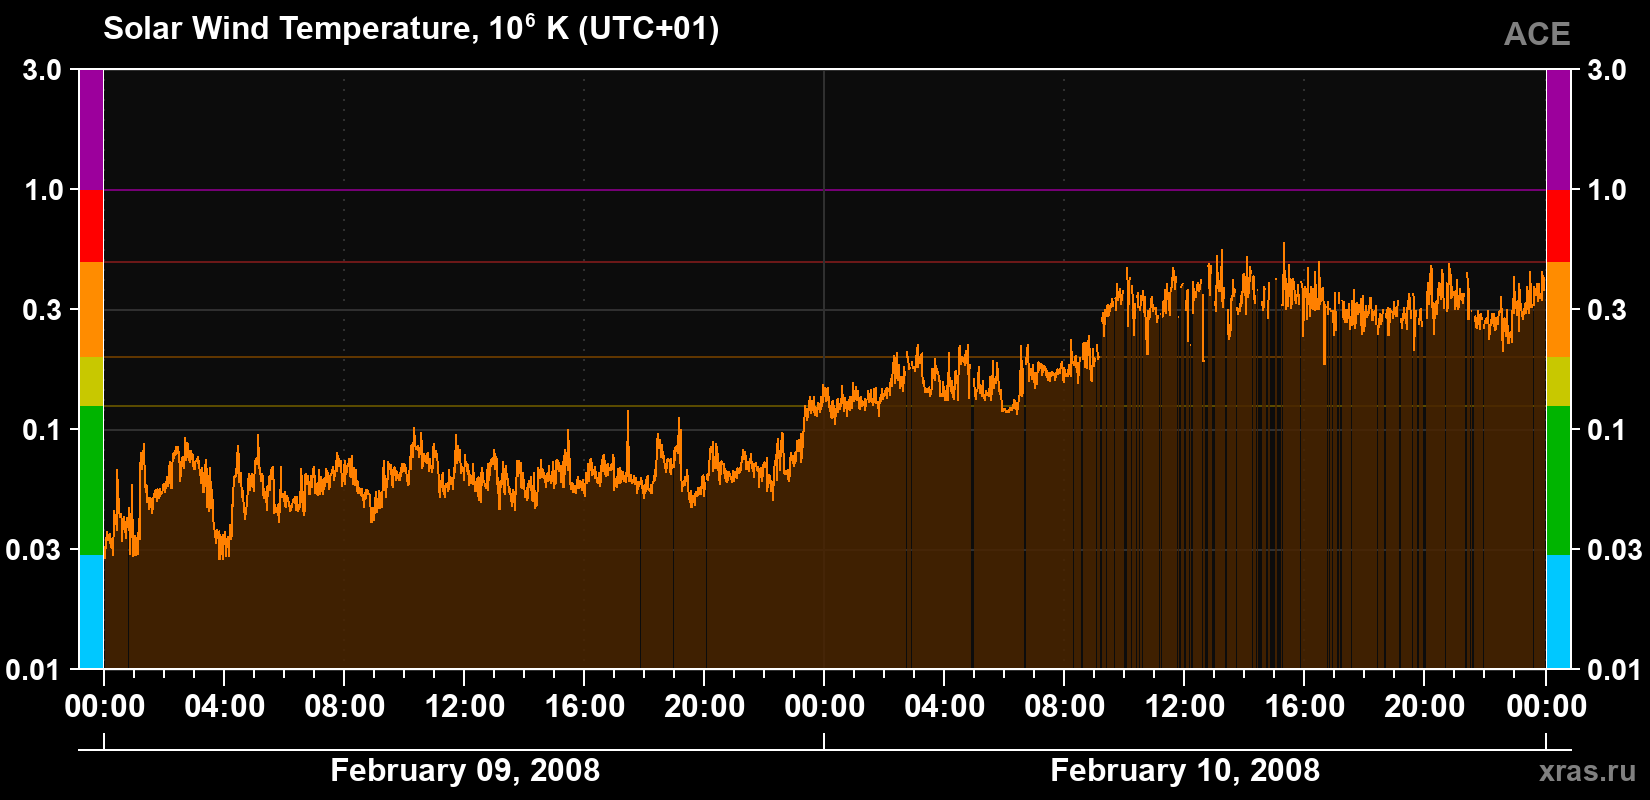
Solar wind temperature
254 000 K
high
(average for 24 hours)
Solar wind temperature for February 9 and 10, 2008.
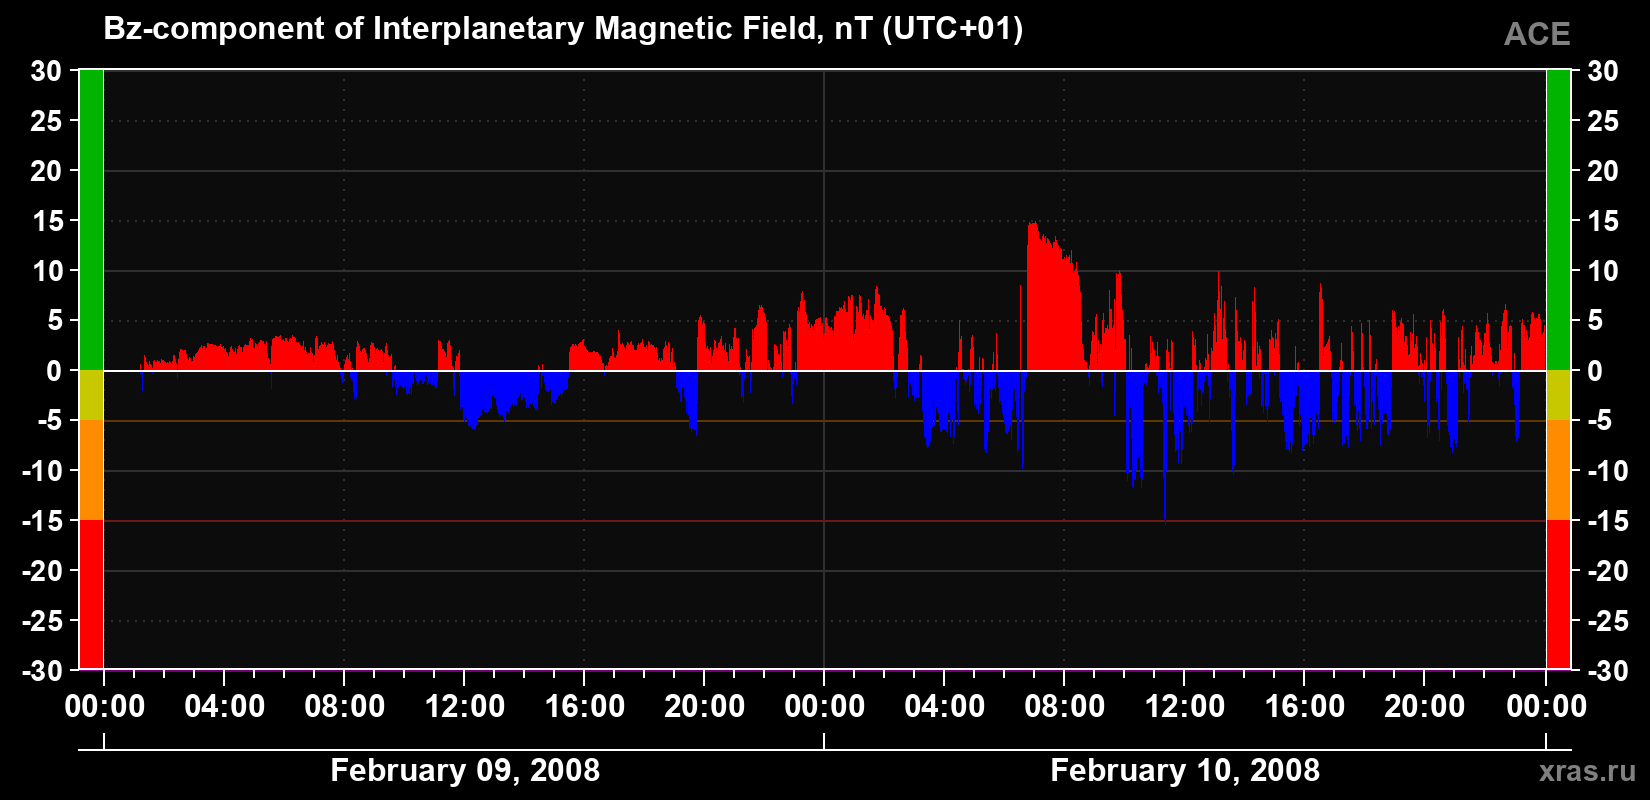
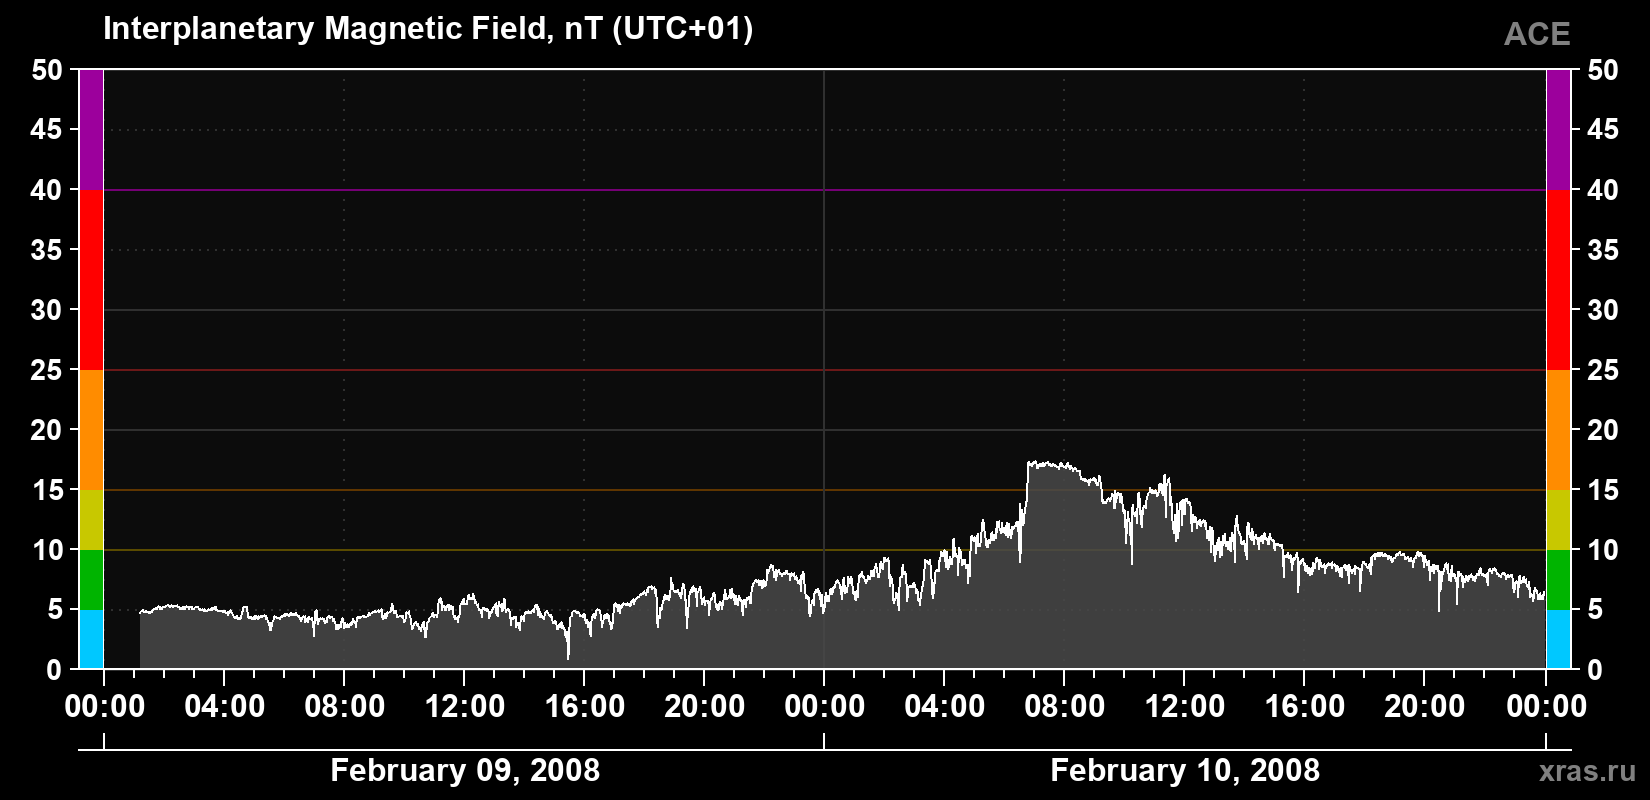
Solar wind magnetic field induction
10.2 nT
increased
(average for 24 hours)
Solar wind magnetic field induction for February 9 and 10, 2008.
The Bz component of the solar wind magnetic field
+0.6 nT
positive
(average for 24 hours)
The Bz component of the solar wind magnetic field for February 9 and 10, 2008.