Solar wind parameters
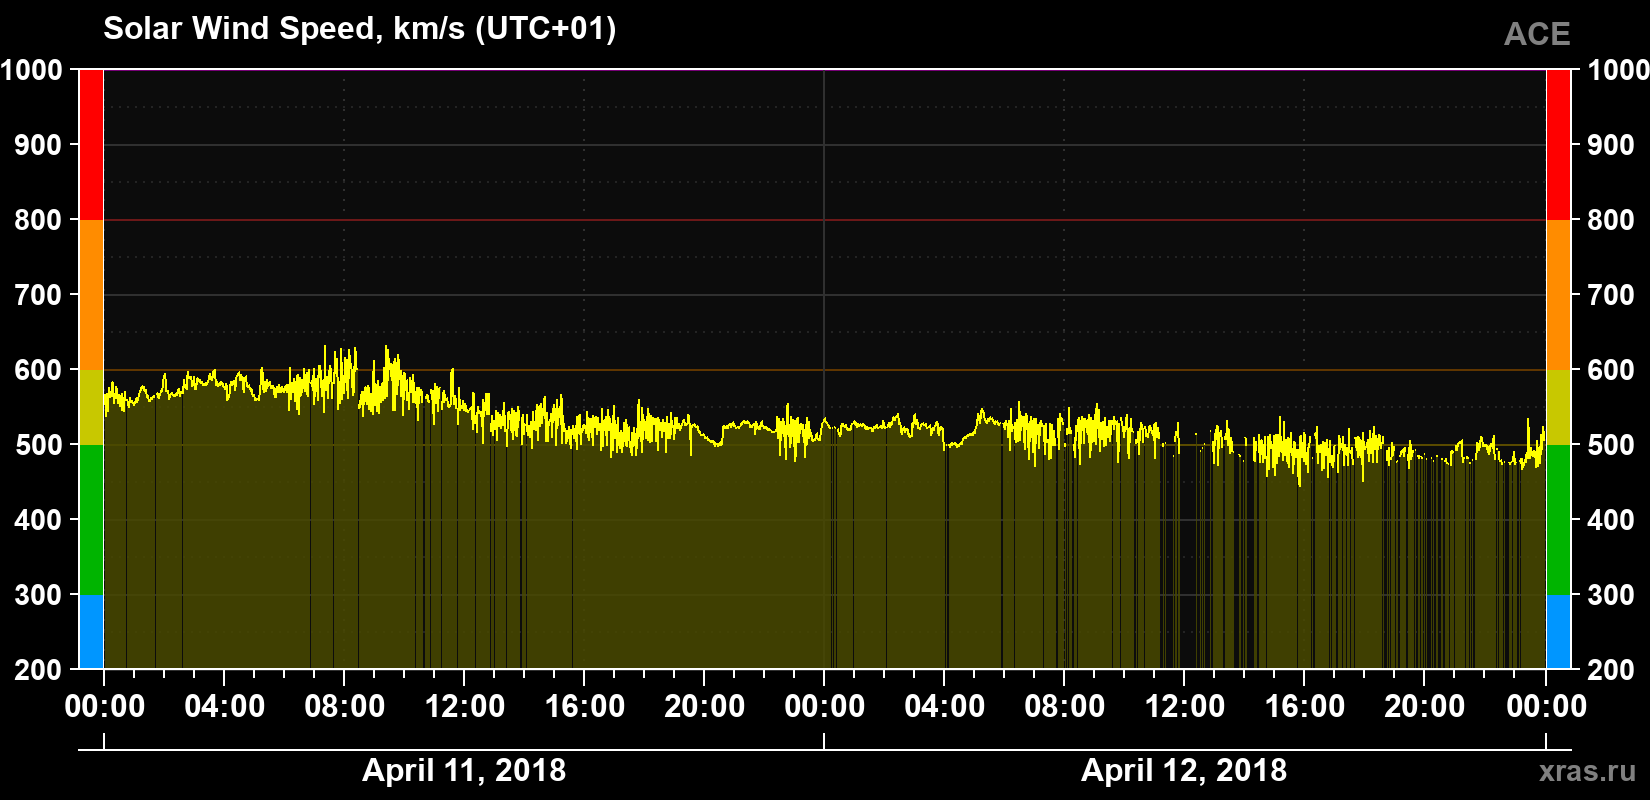
Solar wind speed
510 km/s
increased
(average for 24 hours)
Solar wind speed for April 11 and 12, 2018.
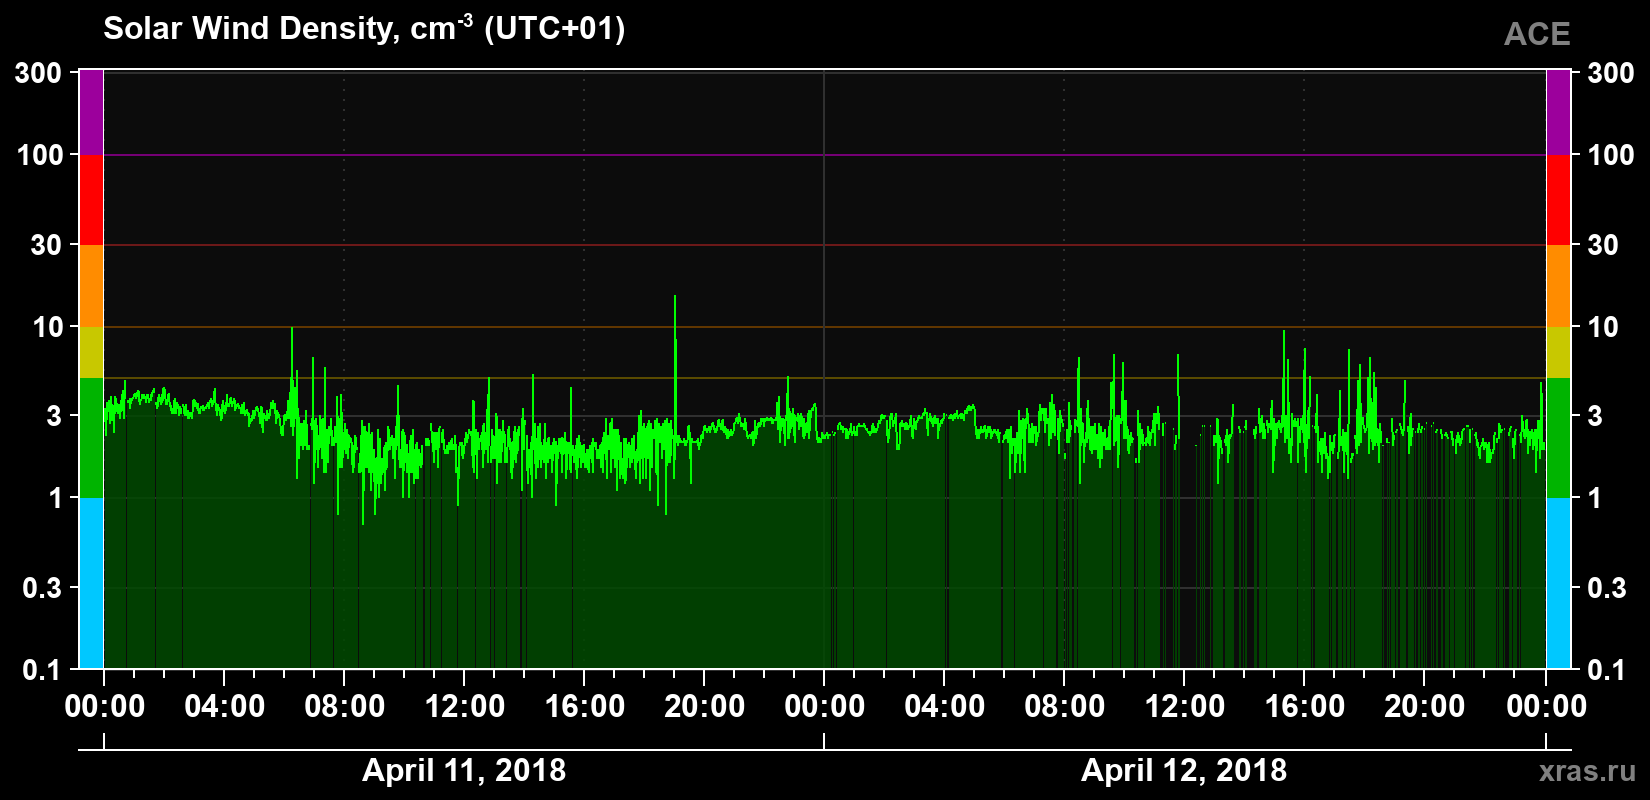
Solar wind density
2.5 cm-3
normal
(average for 24 hours)
Solar wind density for April 11 and 12, 2018.
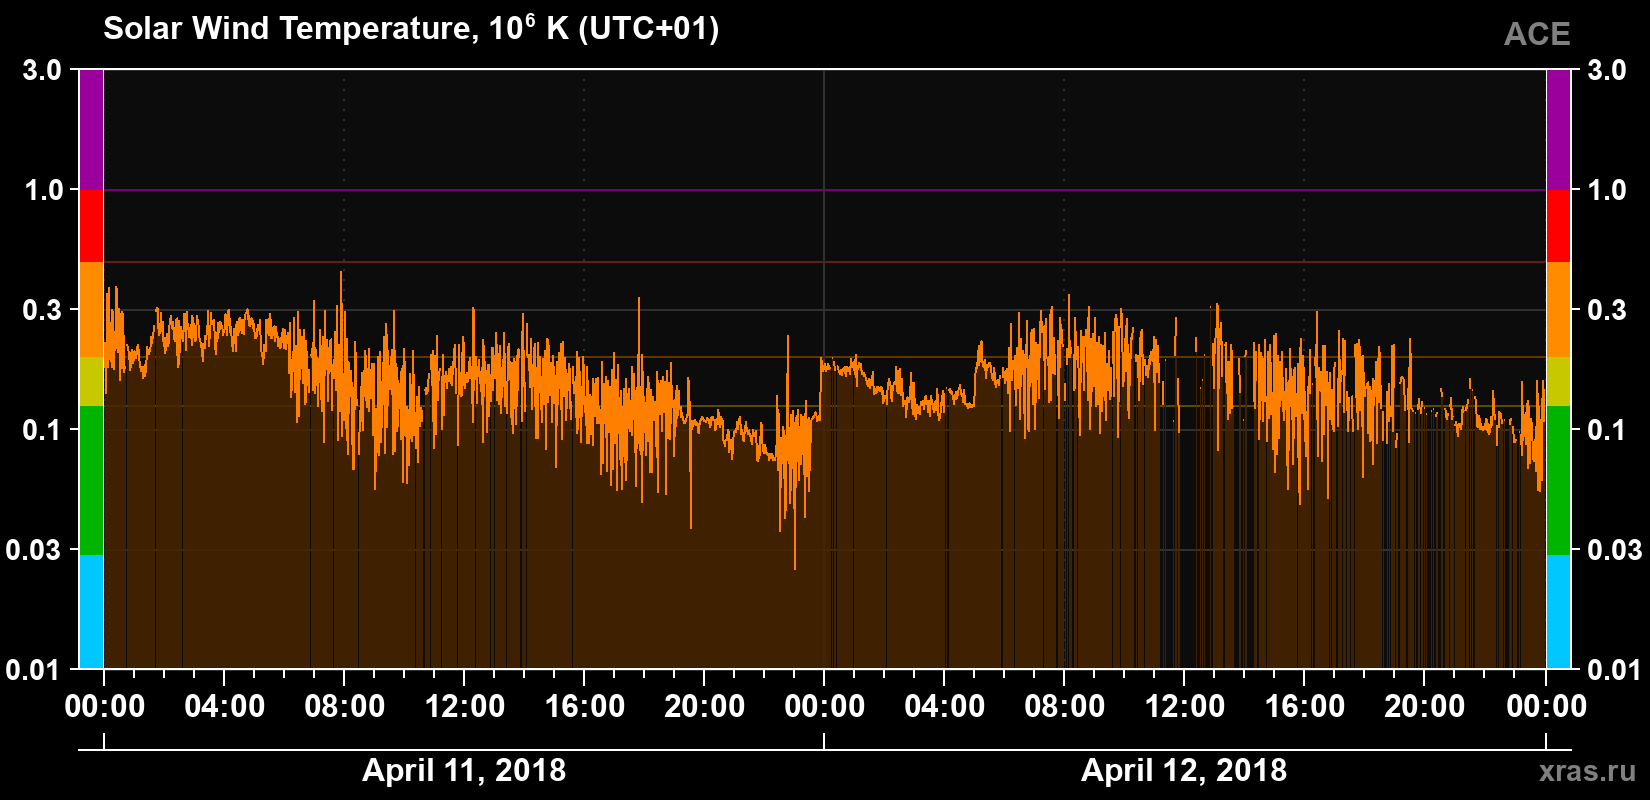
Solar wind temperature
156 000 K
increased
(average for 24 hours)
Solar wind temperature for April 11 and 12, 2018.
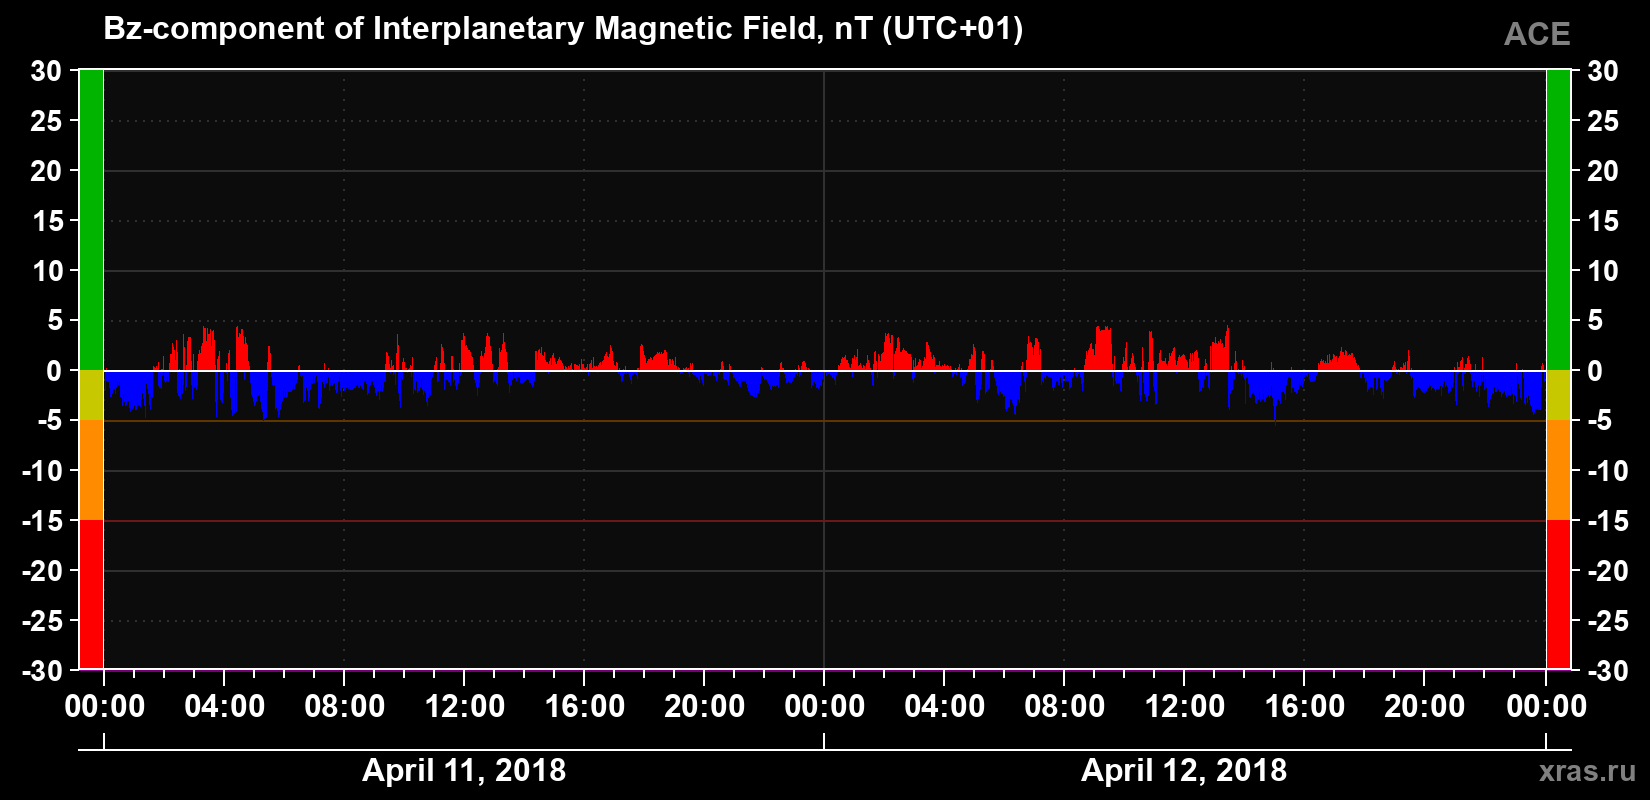
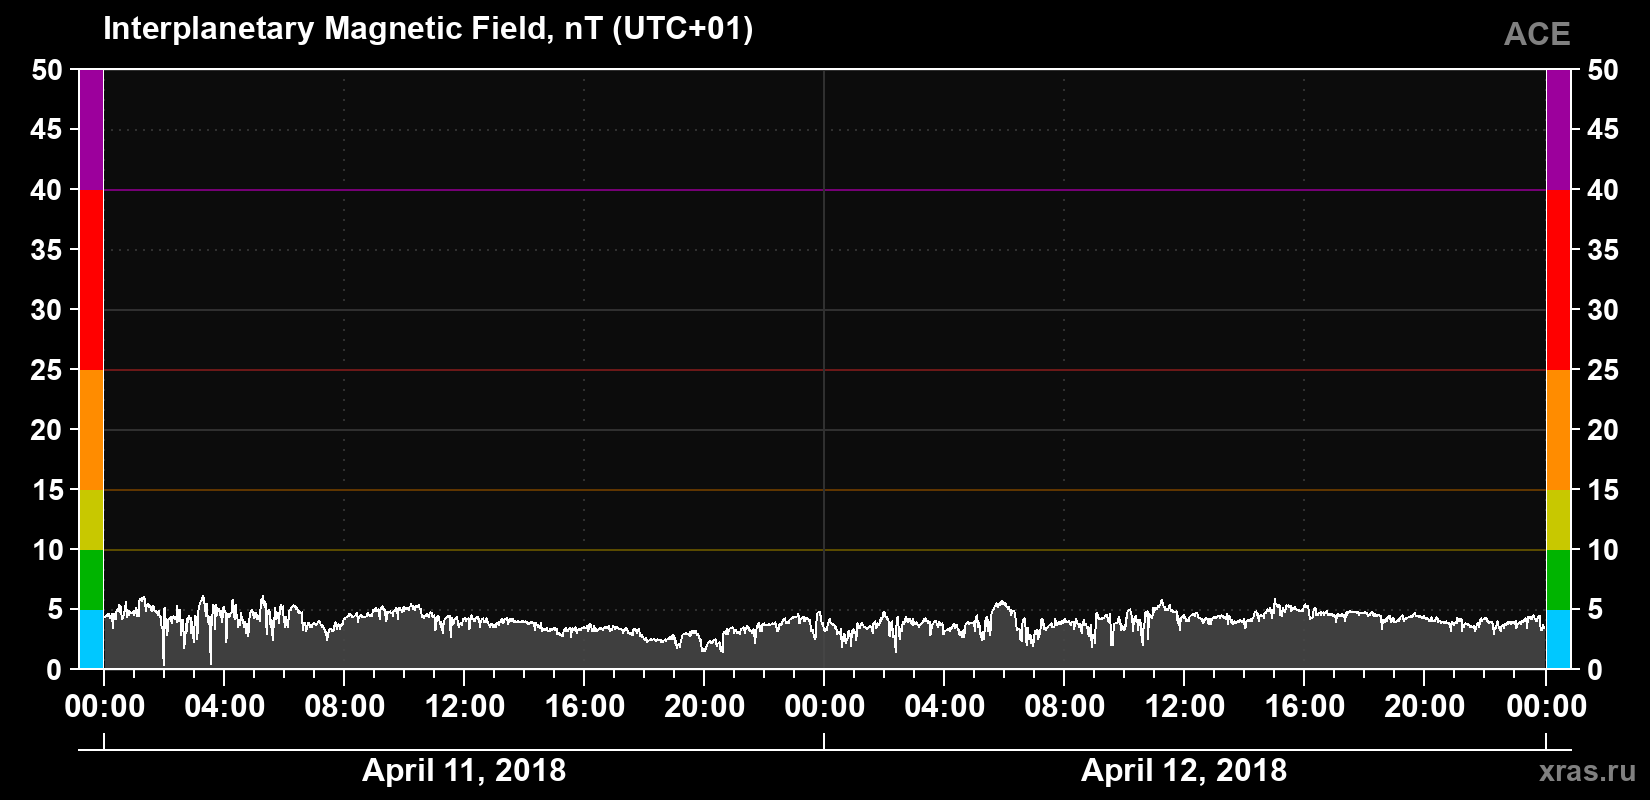
Solar wind magnetic field induction
4 nT
normal
(average for 24 hours)
Solar wind magnetic field induction for April 11 and 12, 2018.
The Bz component of the solar wind magnetic field
−0.2 nT
negative
(average for 24 hours)
The Bz component of the solar wind magnetic field for April 11 and 12, 2018.