Solar wind parameters
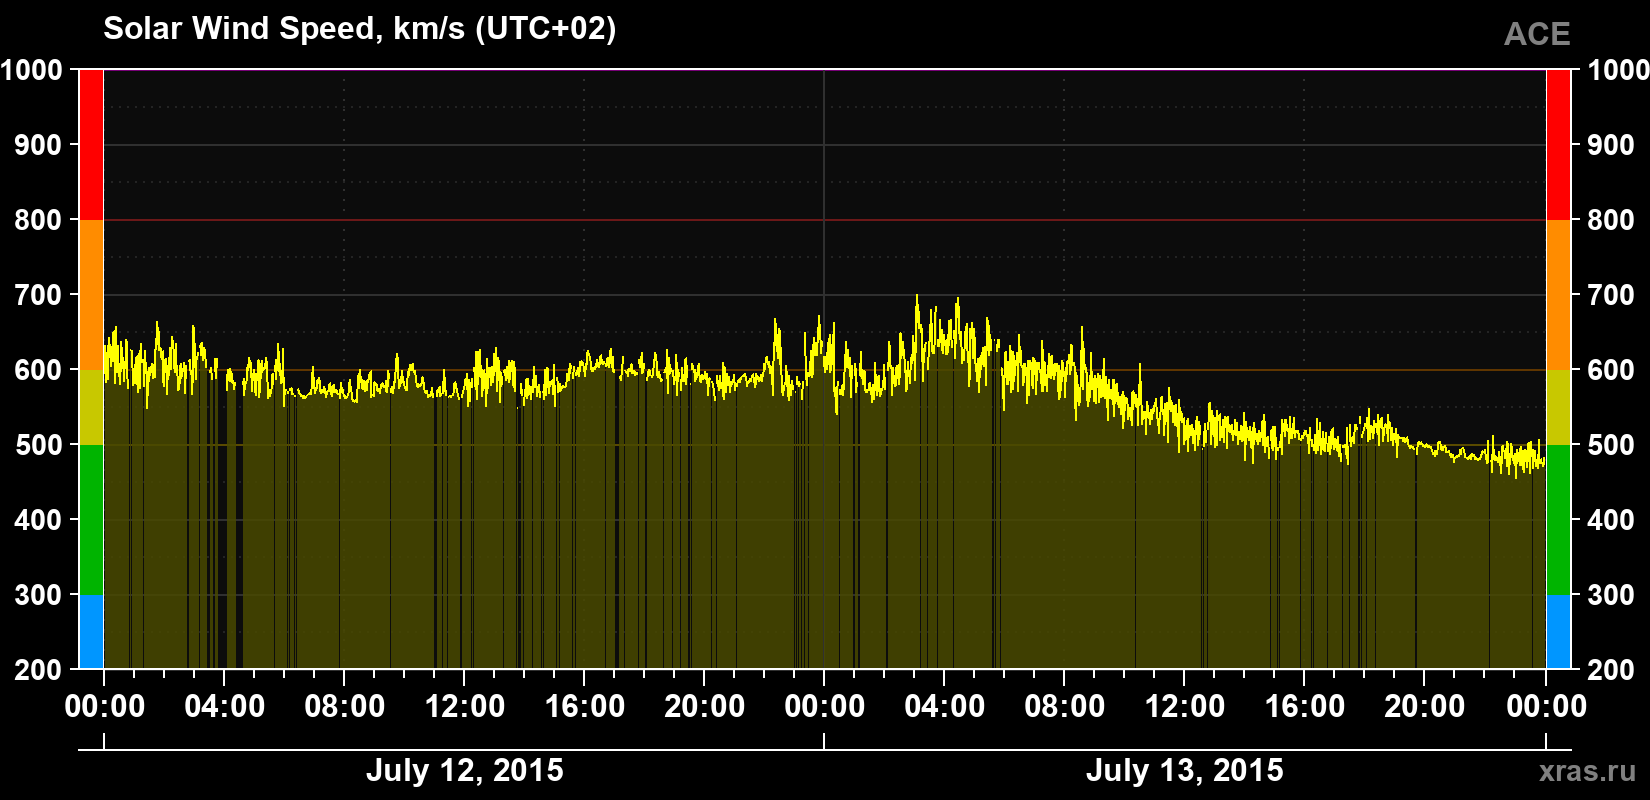
Solar wind speed
548 km/s
increased
(average for 24 hours)
Solar wind speed for July 12 and 13, 2015.
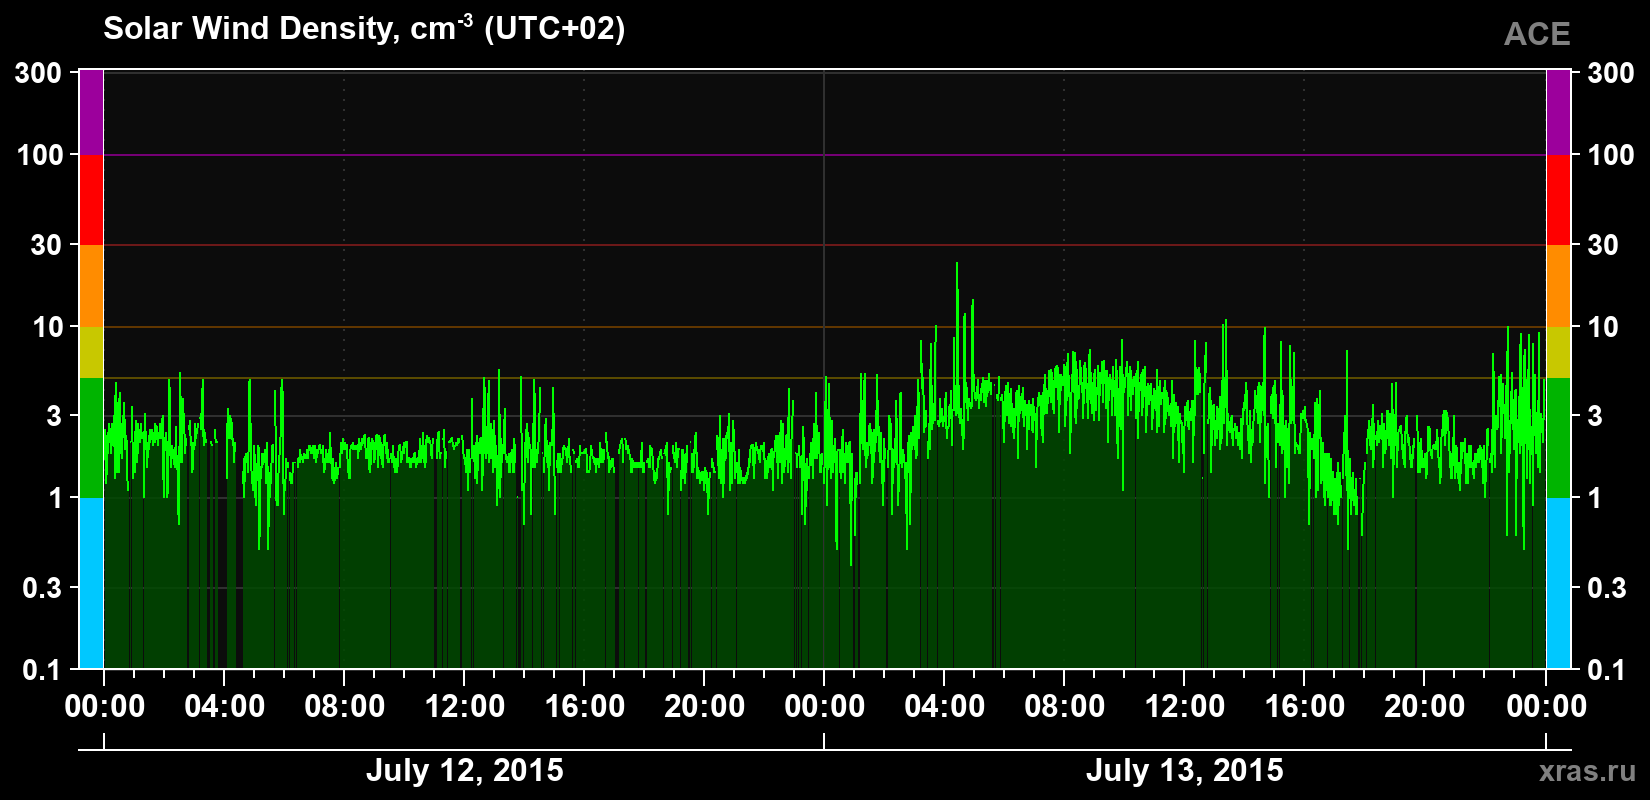
Solar wind density
2.9 cm-3
normal
(average for 24 hours)
Solar wind density for July 12 and 13, 2015.
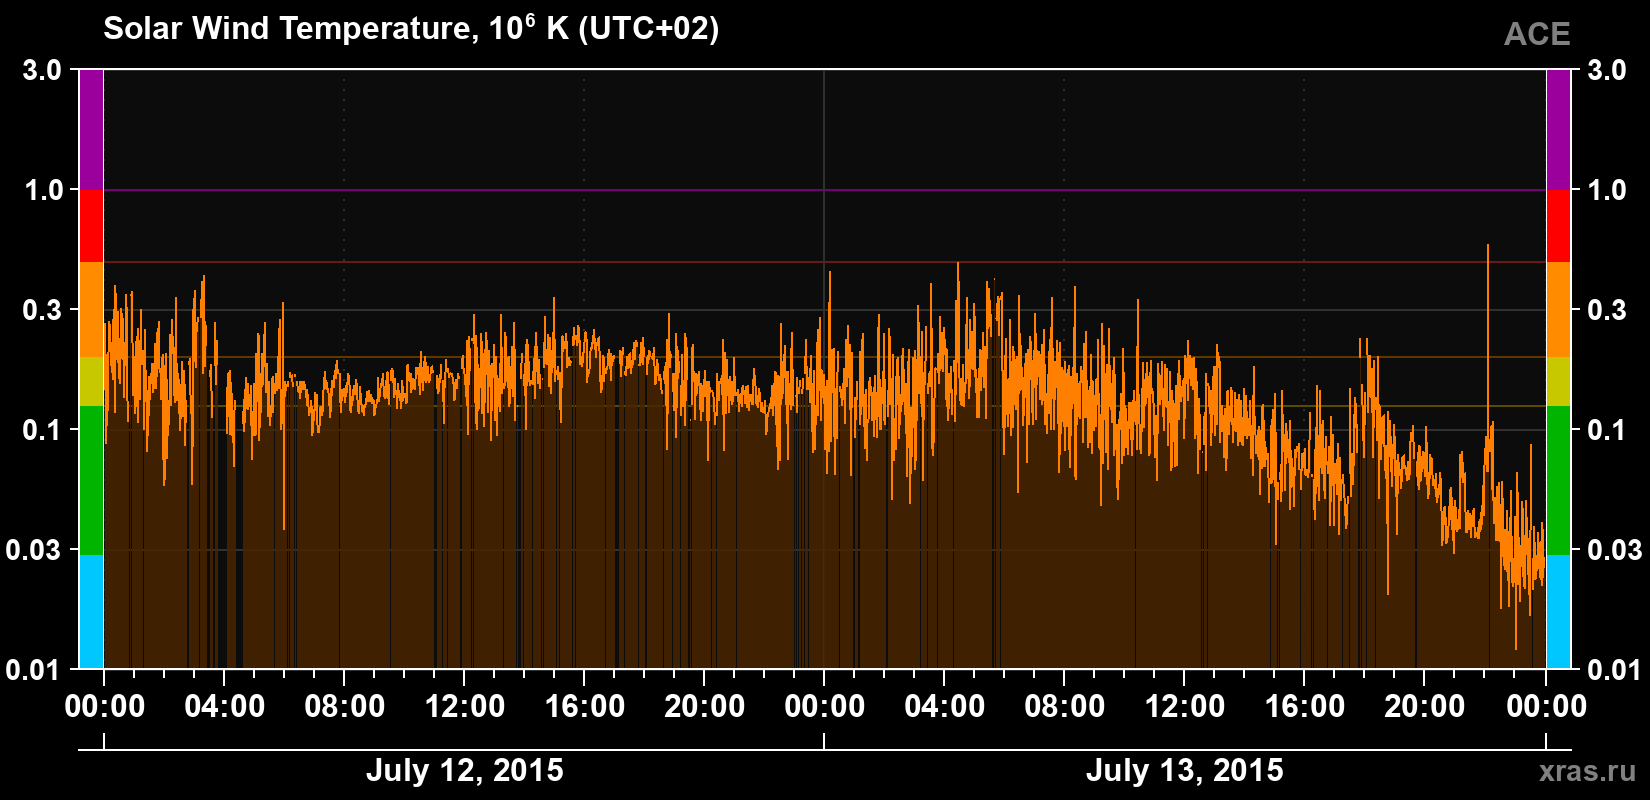
Solar wind temperature
114 000 K
normal
(average for 24 hours)
Solar wind temperature for July 12 and 13, 2015.
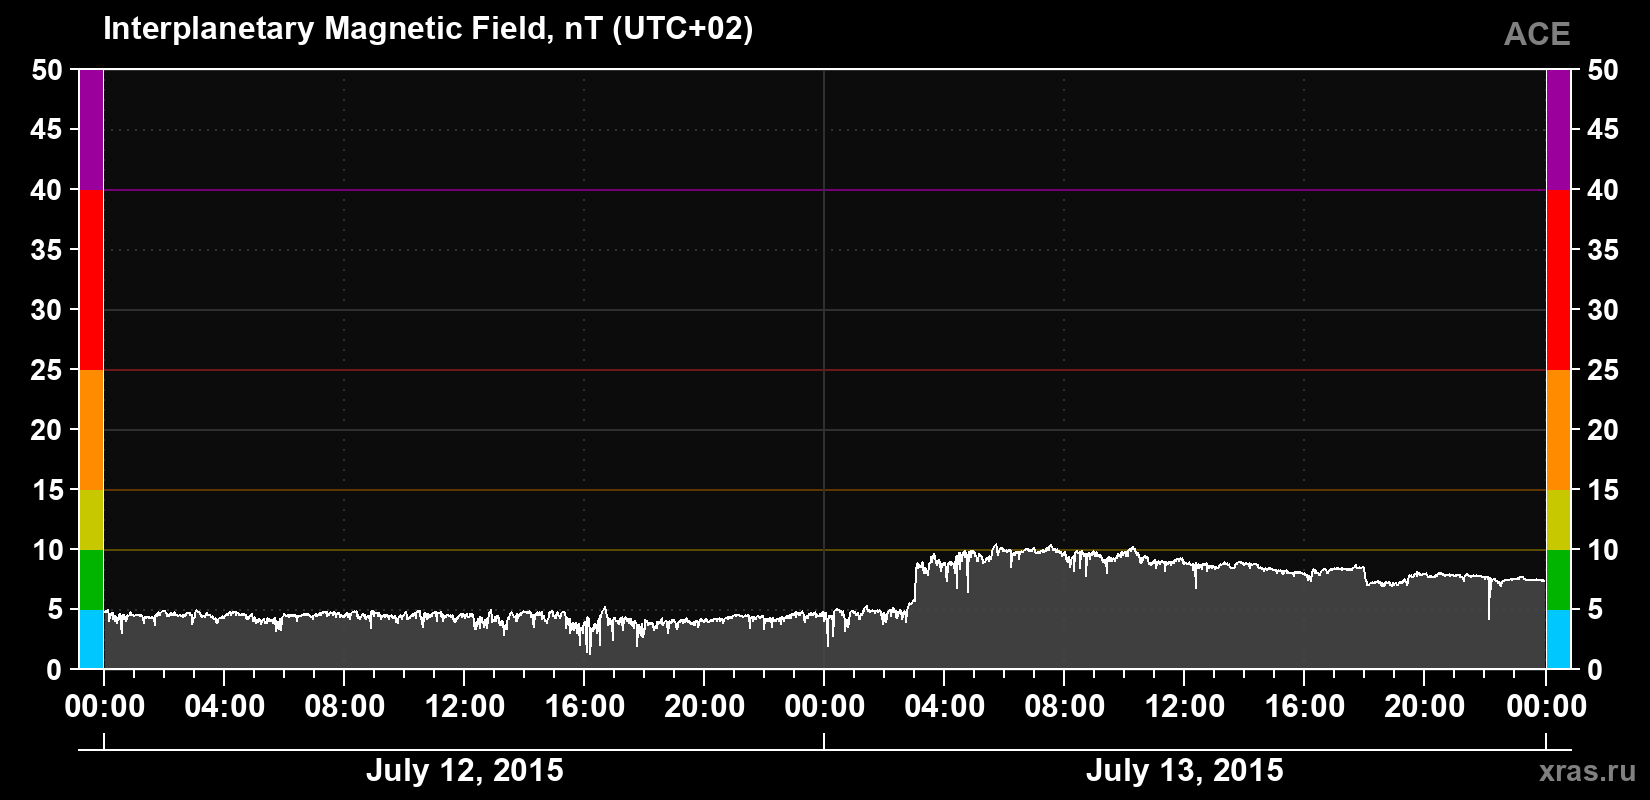
Solar wind magnetic field induction
8.2 nT
normal
(average for 24 hours)
Solar wind magnetic field induction for July 12 and 13, 2015.
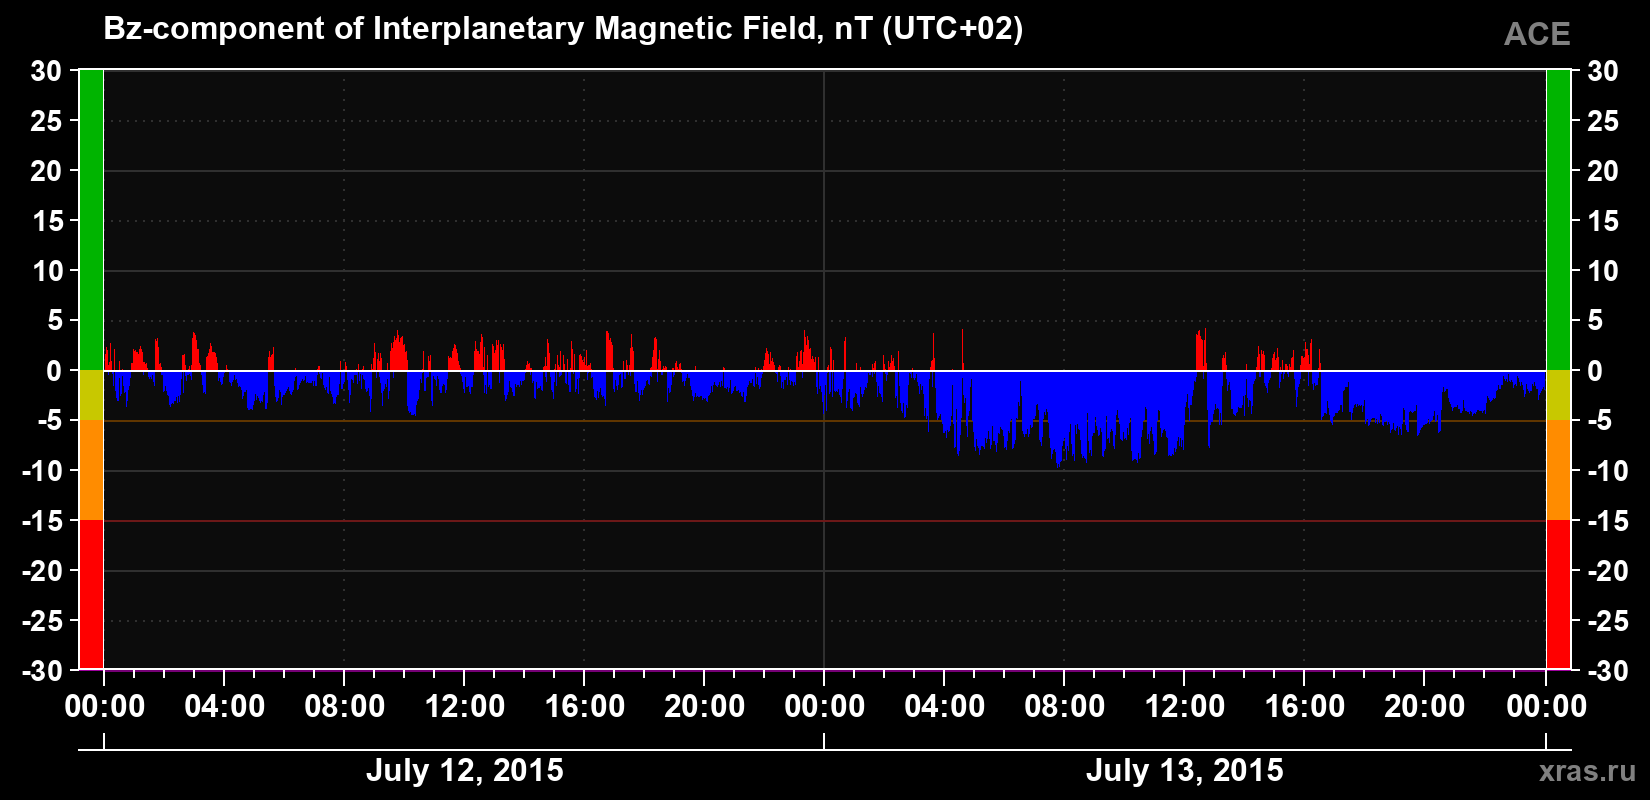
The Bz component of the solar wind magnetic field
−3.6 nT
negative
(average for 24 hours)
The Bz component of the solar wind magnetic field for July 12 and 13, 2015.