Solar wind parameters
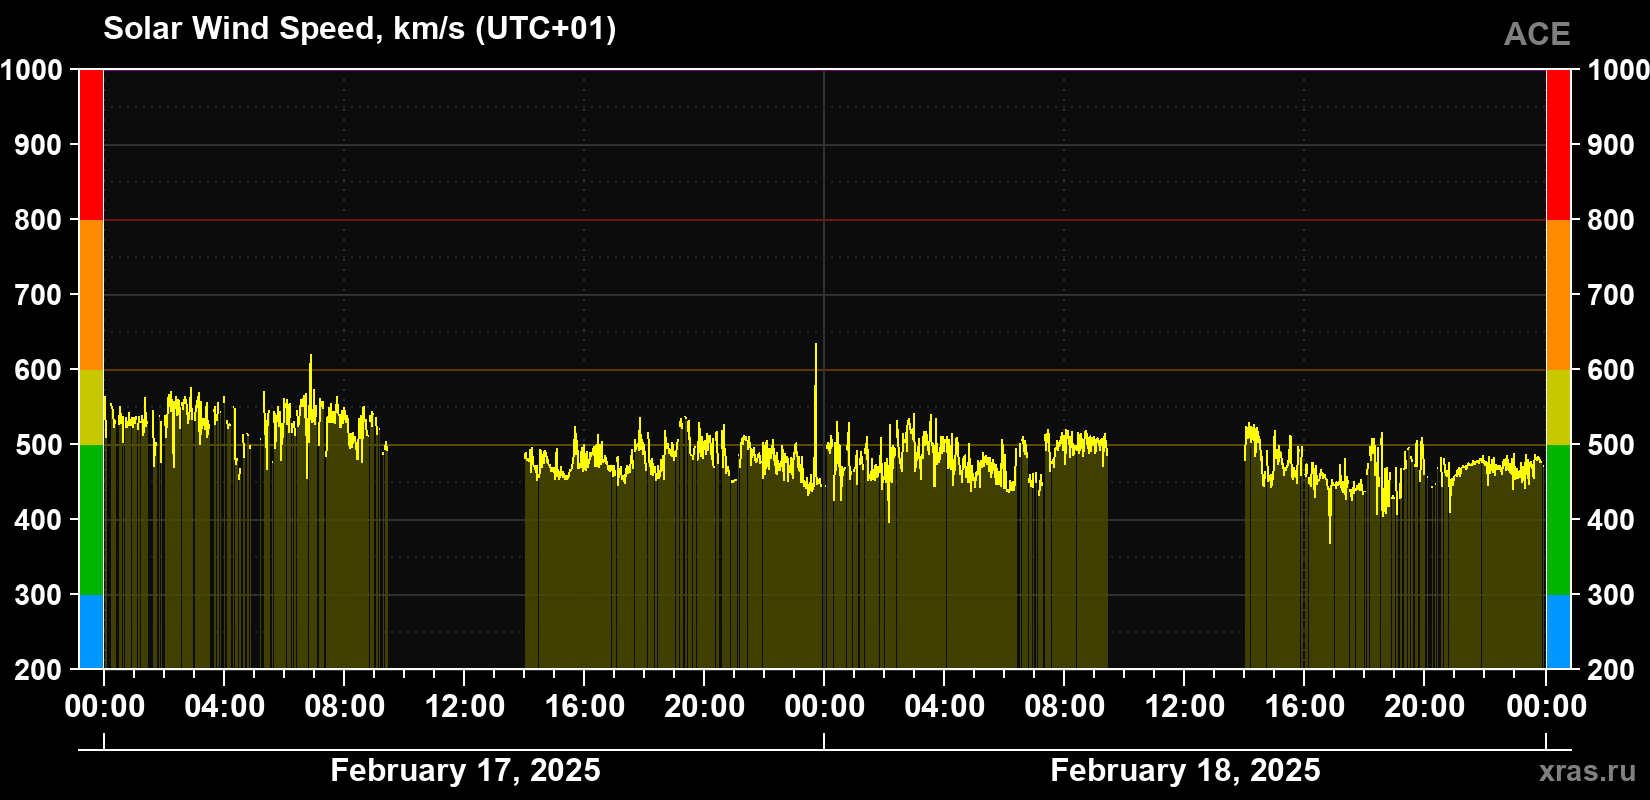
Solar wind speed
476 km/s
normal
(average for 24 hours)
Solar wind speed for February 17 and 18, 2025.
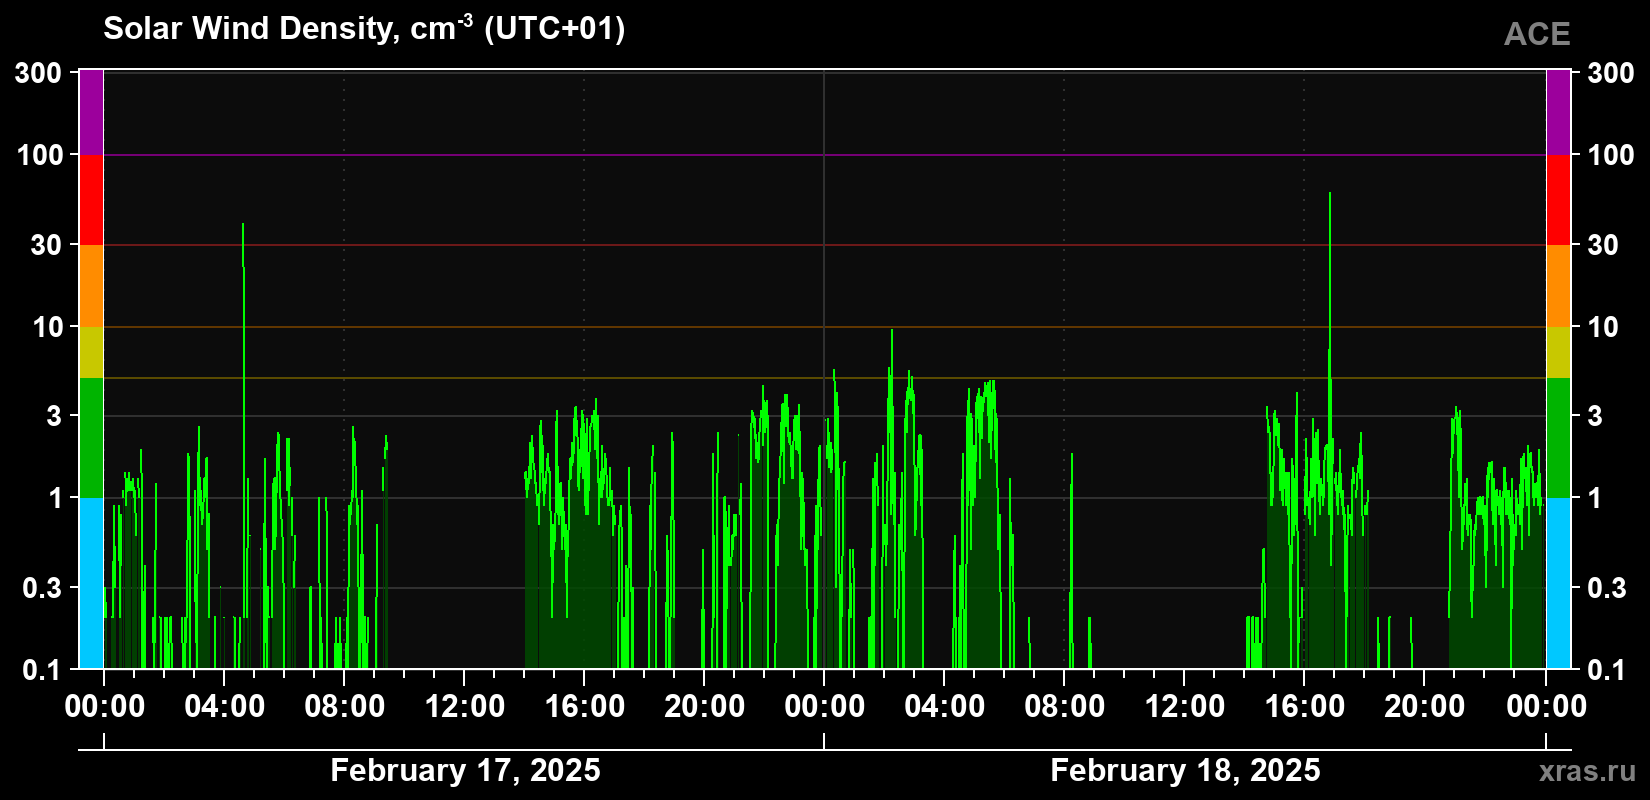
Solar wind density
1 cm-3
normal
(average for 24 hours)
Solar wind density for February 17 and 18, 2025.
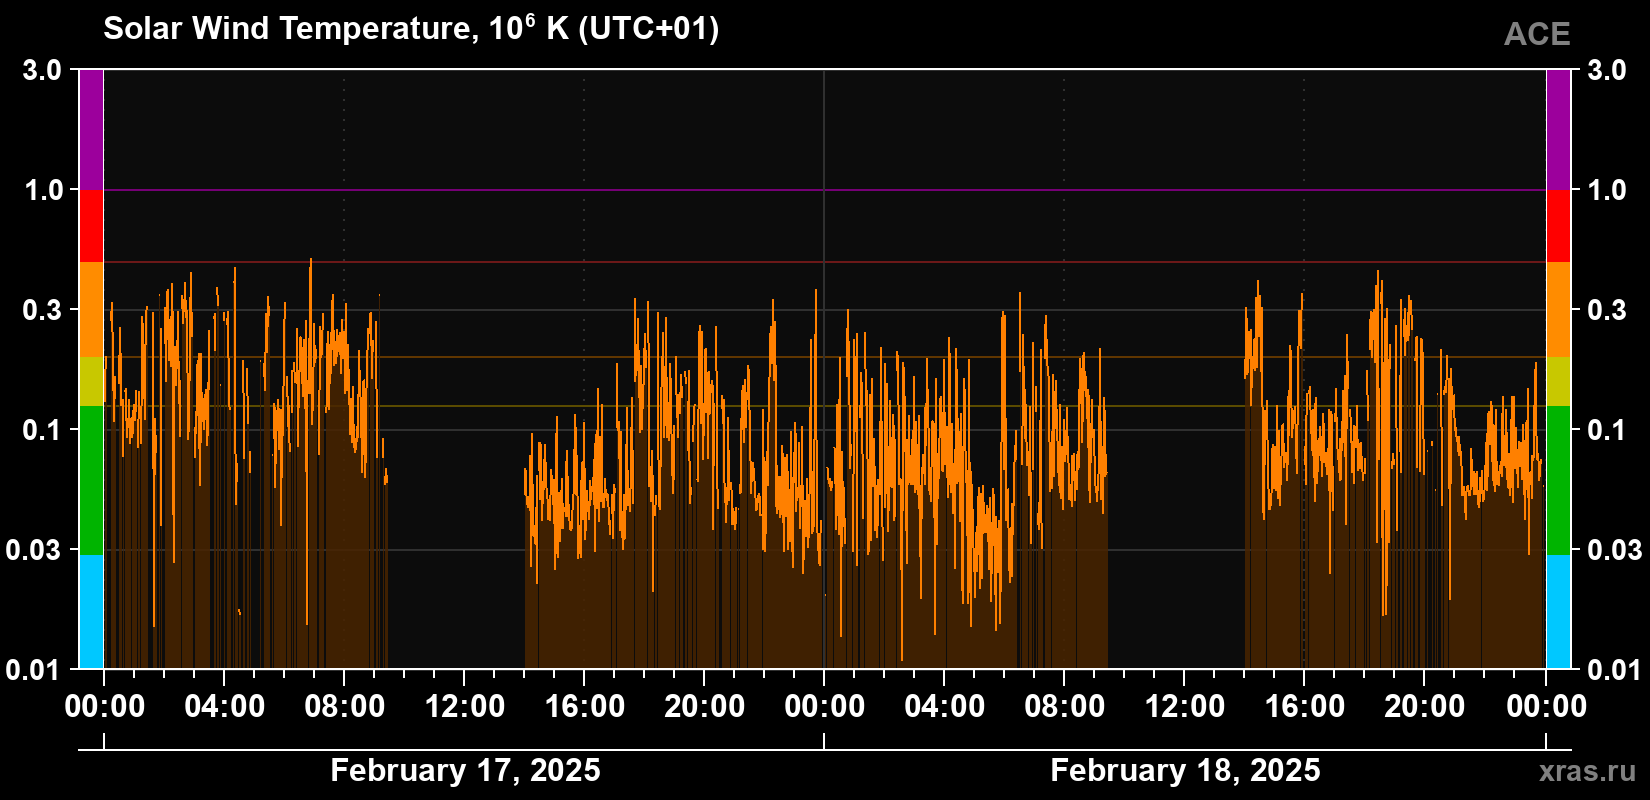
Solar wind temperature
91 000 K
normal
(average for 24 hours)
Solar wind temperature for February 17 and 18, 2025.
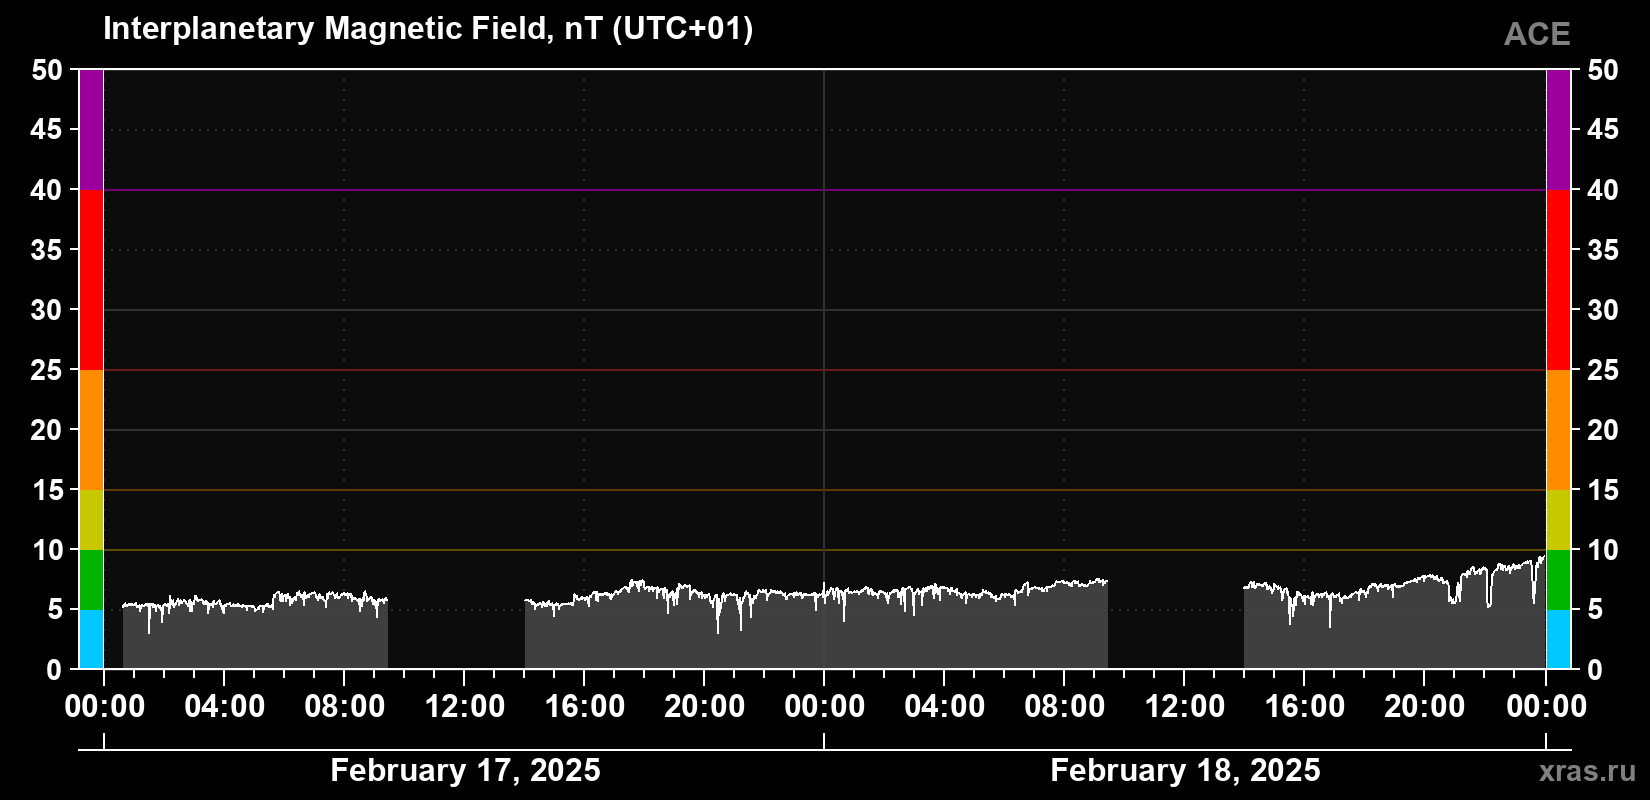
Solar wind magnetic field induction
6.8 nT
normal
(average for 24 hours)
Solar wind magnetic field induction for February 17 and 18, 2025.
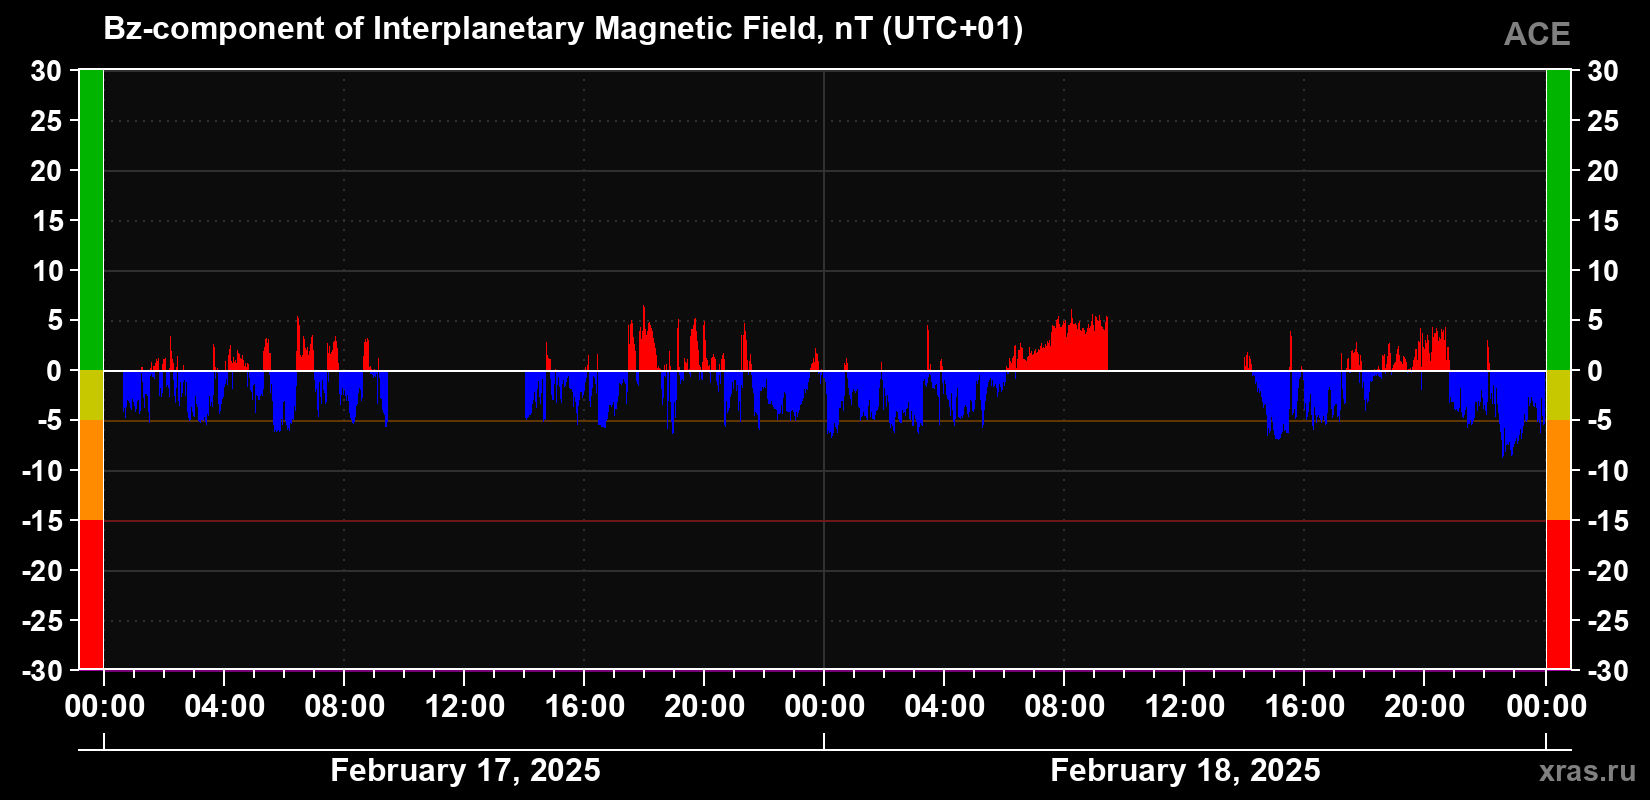
The Bz component of the solar wind magnetic field
−1.5 nT
negative
(average for 24 hours)
The Bz component of the solar wind magnetic field for February 17 and 18, 2025.