Solar wind parameters
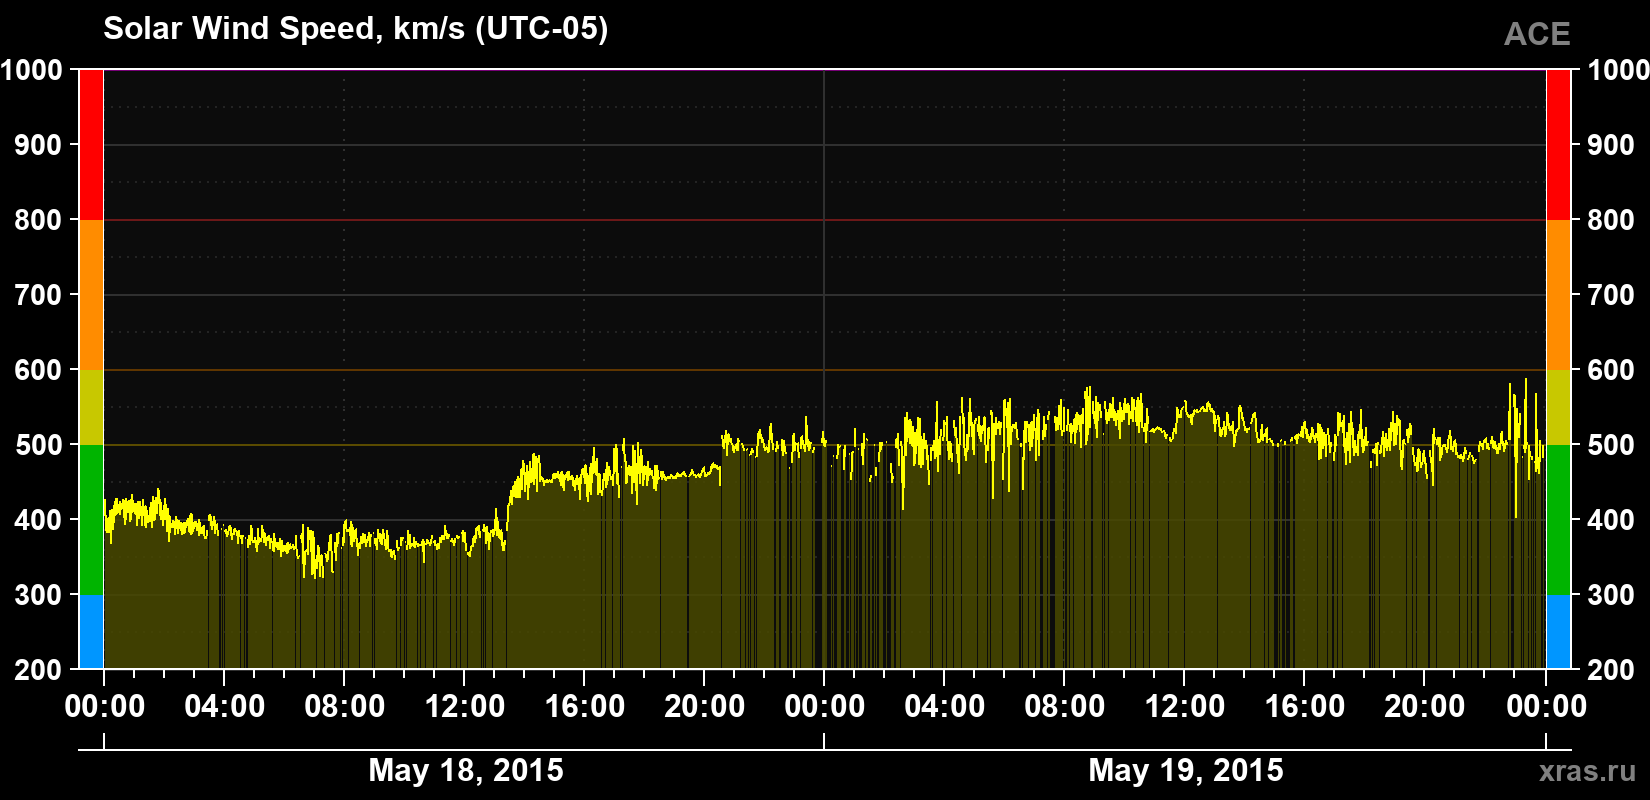
Solar wind speed
514 km/s
increased
(average for 24 hours)
Solar wind speed for May 18 and 19, 2015.
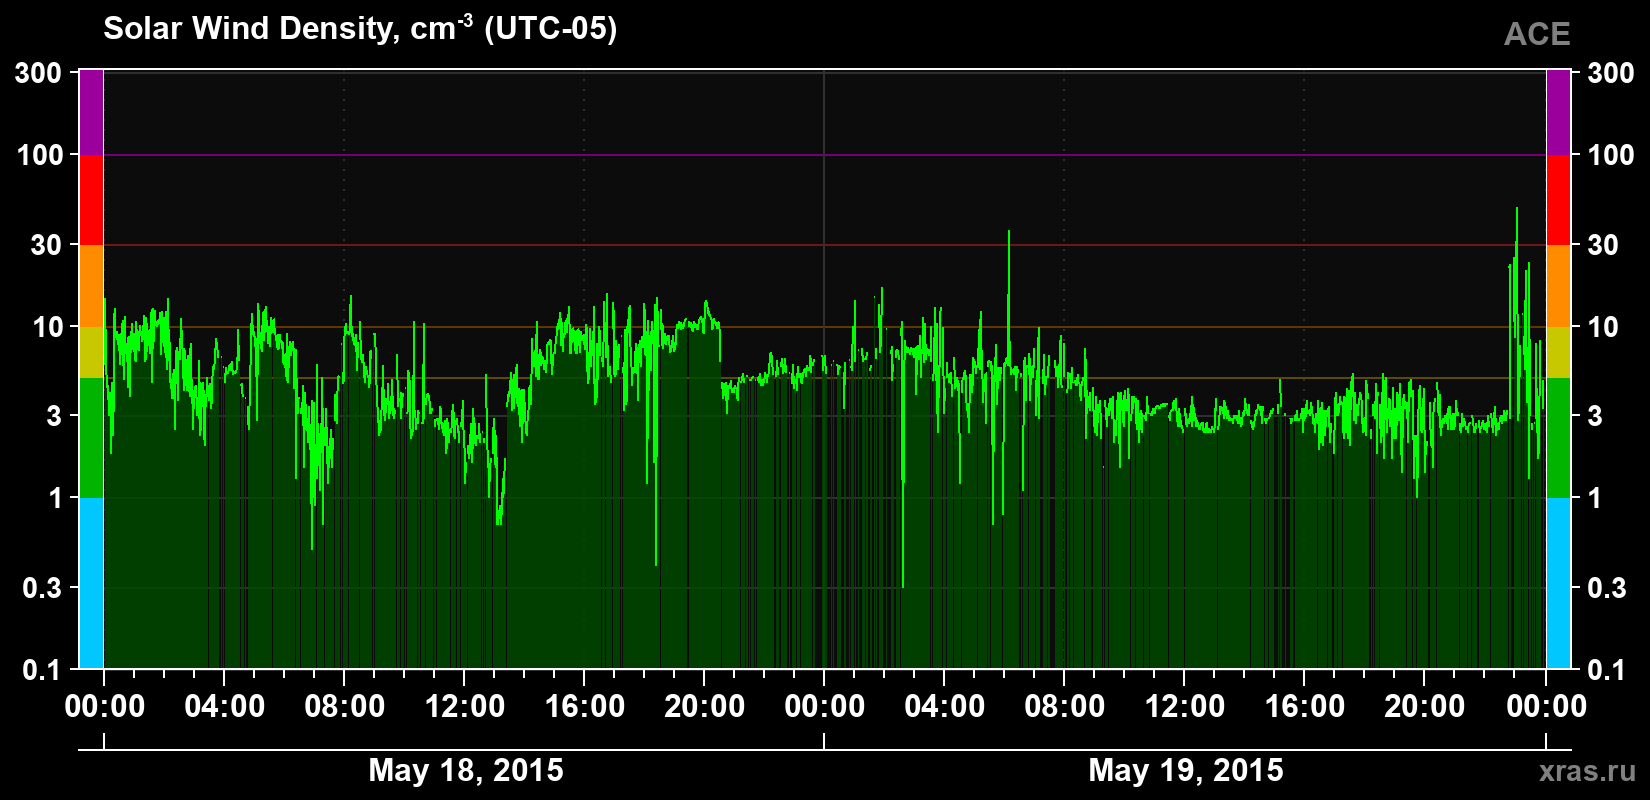
Solar wind density
3.8 cm-3
normal
(average for 24 hours)
Solar wind density for May 18 and 19, 2015.
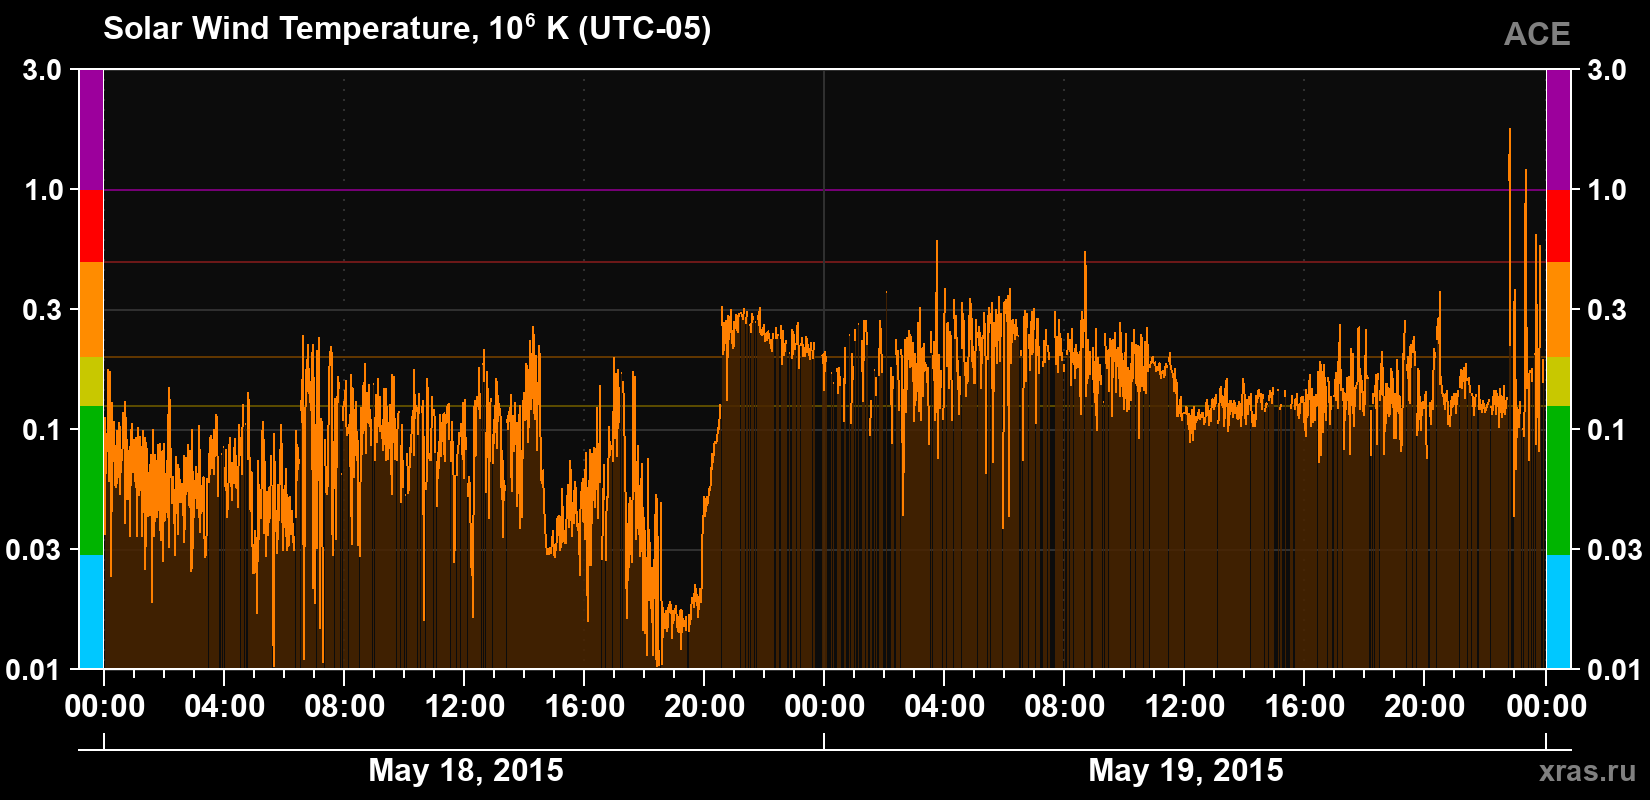
Solar wind temperature
163 000 K
increased
(average for 24 hours)
Solar wind temperature for May 18 and 19, 2015.
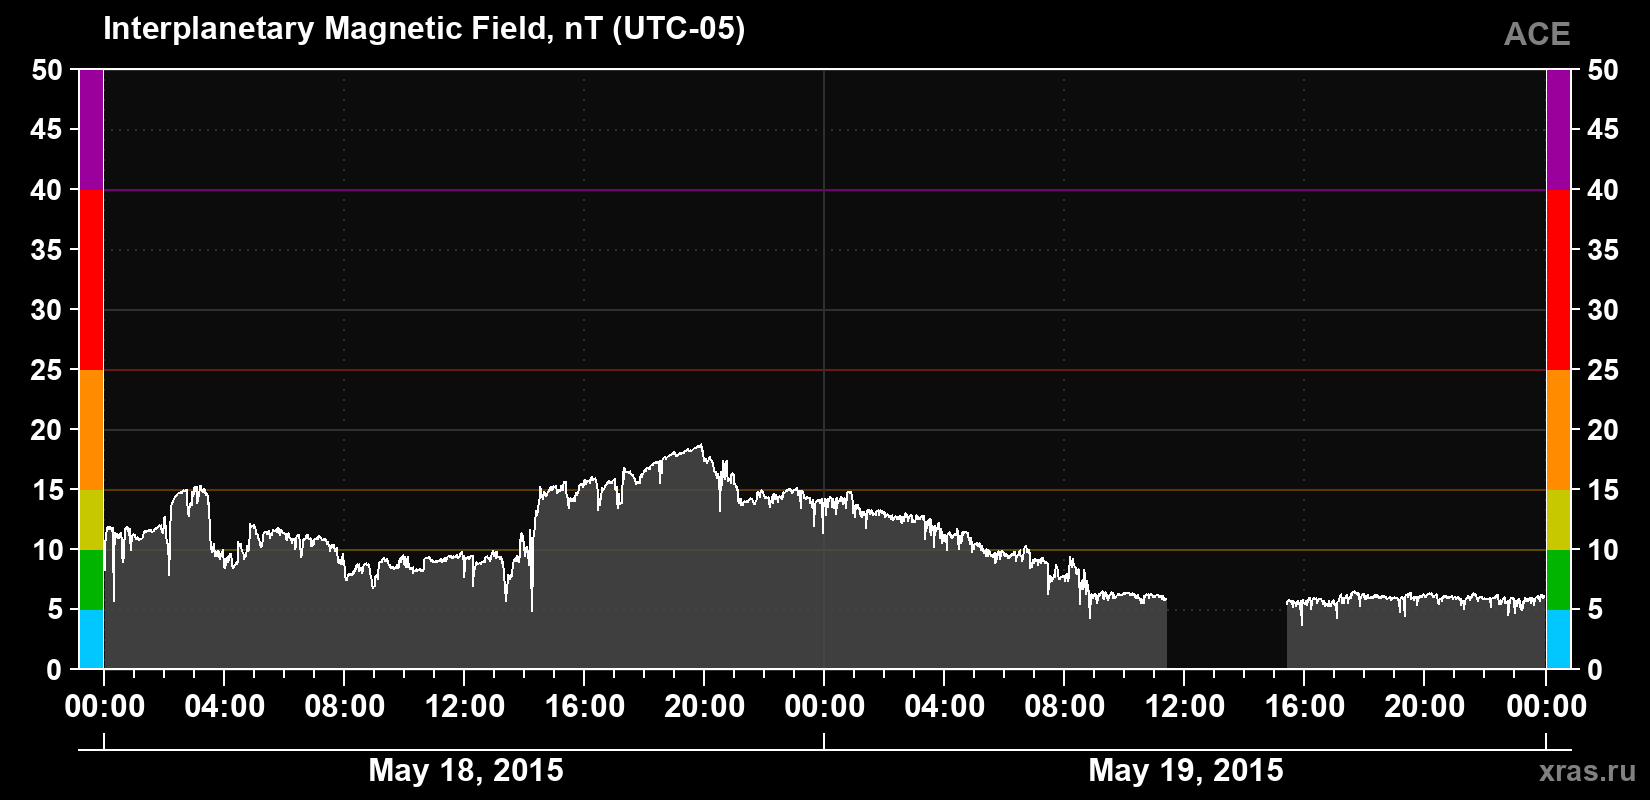
Solar wind magnetic field induction
8 nT
normal
(average for 24 hours)
Solar wind magnetic field induction for May 18 and 19, 2015.
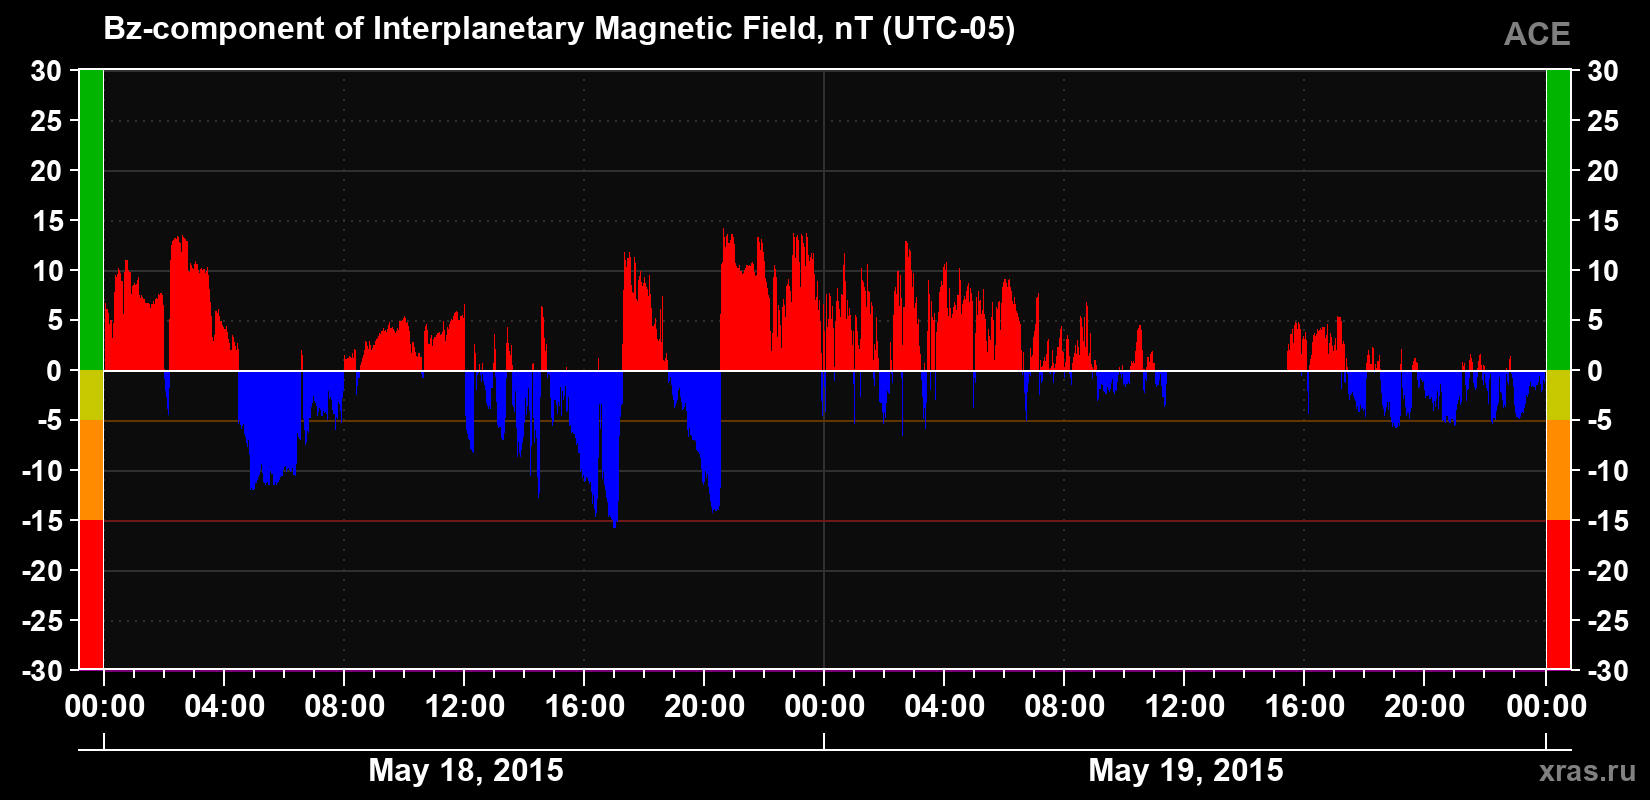
The Bz component of the solar wind magnetic field
+1.4 nT
positive
(average for 24 hours)
The Bz component of the solar wind magnetic field for May 18 and 19, 2015.