Solar flares on January 14, 2013
The most powerful solar flare in 24 hours
C6.5 (normal) flare - January 14 at 4:22 AM
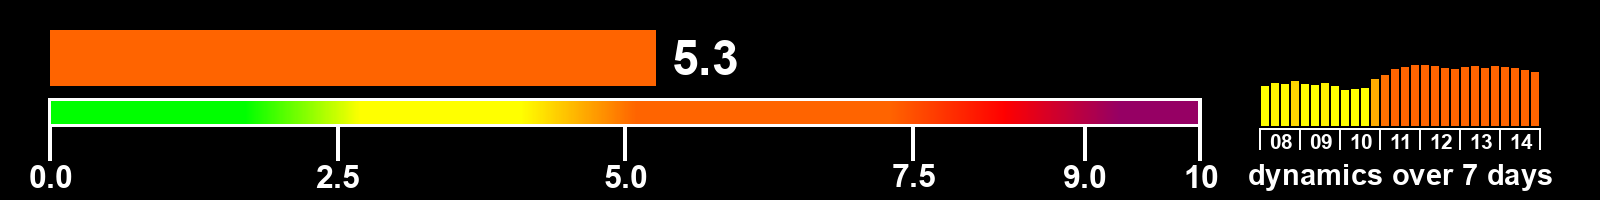
Solar activity index
Value as of the end of the day on January 14, 2013
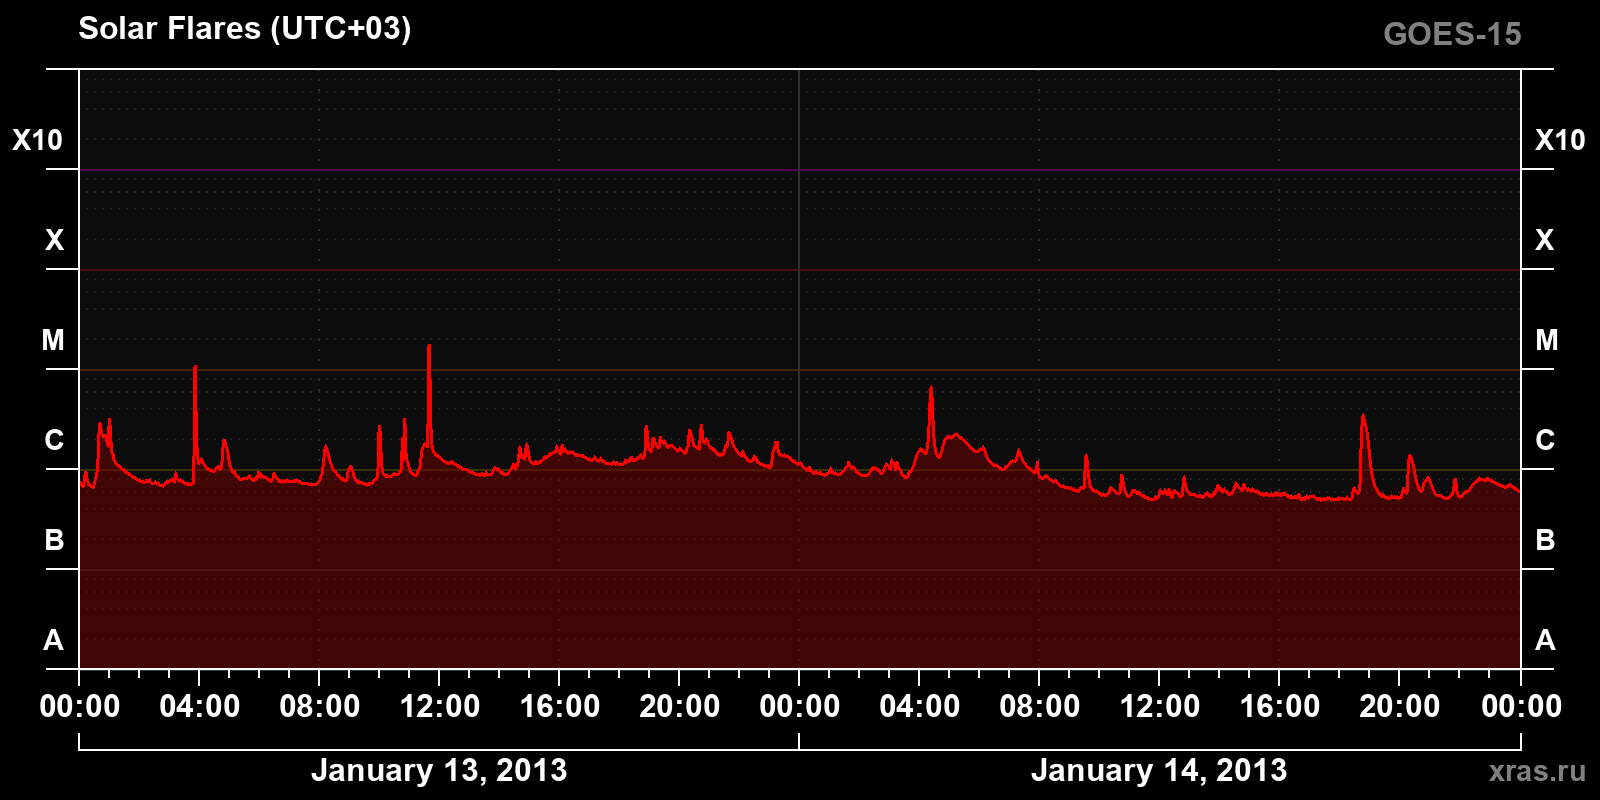
Solar X-ray emission over the past 2 days
Chart of solar X-ray emission (1-8 Å) from January 13, 2013 to January 14, 2013
Time zone — UTC+03 (Moscow)
List of solar flares for January 14, 2013
The total number of solar flares of class C and higher — 6 flares
C class — 6 | M class — 0 | X class — 0
| Class | begin | max | end | region |
|---|---|---|---|---|
| C1.3 | 20:13 | 20:20 | 20:29 | 1654 |
| C3.4 | 18:38 | 18:46 | 18:56 | 1654 |
| C1.3 | 09:27 | 09:32 | 09:36 | 1652 |
| C1.8 | 07:50 | 07:54 | 07:56 | 1657 |
| C1.5 | 07:13 | 07:17 | 07:21 | 1657 |
| C6.5 | 04:15 | 04:22 | 04:25 | 1652 |