Solar flares on January 16, 2026
The most powerful solar flare in 24 hours
C6.6 (normal) flare - January 16 at 9:09 AM
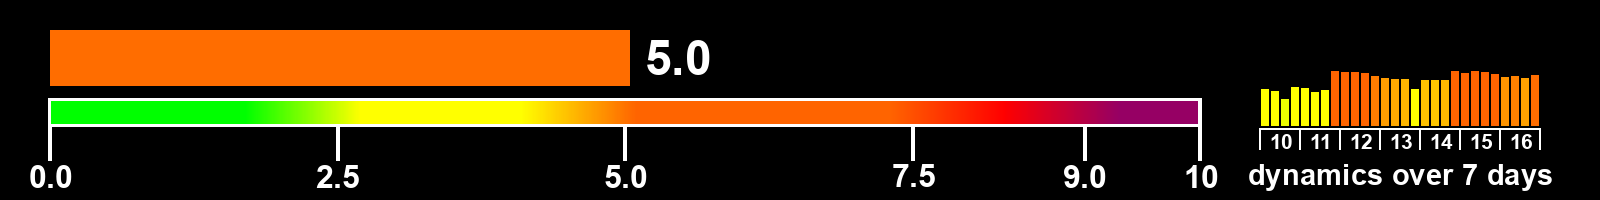
Solar activity index
Value as of the end of the day on January 16, 2026
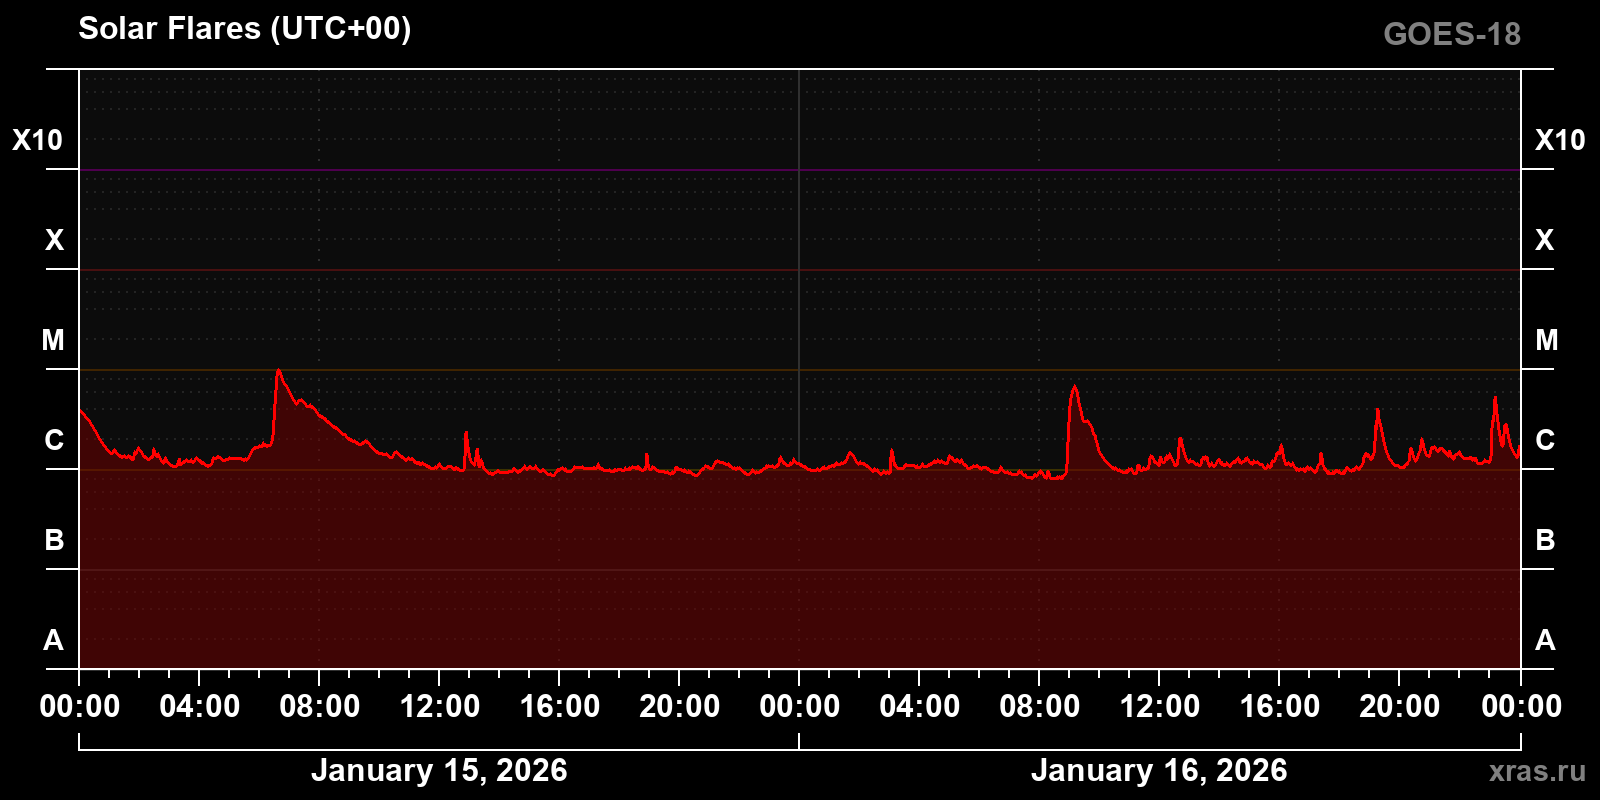
Solar X-ray emission over the past 2 days
Chart of solar X-ray emission (1-8 Å) from January 15, 2026 to January 16, 2026
Time zone — UTC+00
List of solar flares for January 16, 2026
The total number of solar flares of class C and higher — 10 flares
C class — 10 | M class — 0 | X class — 0
| Class | begin | max | end | region |
|---|---|---|---|---|
| C2.8 | 23:25 | 23:30 | 23:36 | 4342 |
| C5.2 | 22:58 | 23:10 | 23:15 | 4343 |
| C1.9 | 20:36 | 20:43 | 20:47 | 4343 |
| C1.5 | 20:14 | 20:22 | 20:26 | 4341 |
| C4.0 | 19:04 | 19:15 | 19:22 | 4343 |
| C1.4 | 17:15 | 17:21 | 17:24 | 4341 |
| C2.0 | 12:31 | 12:40 | 12:46 | 4343 |
| C1.3 | 11:36 | 11:41 | 11:49 | 4343 |
| C6.6 | 08:47 | 09:09 | 09:22 | 4345 |
| C1.5 | 02:59 | 03:03 | 03:08 | 4344 |