Solar flares on January 24, 2015
The most powerful solar flare in 24 hours
C2.0 (normal) flare - January 24 at 7:40 AM
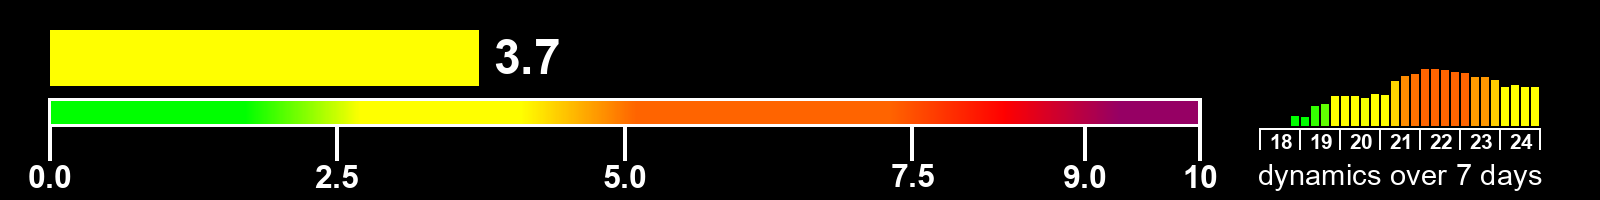
Solar activity index
Value as of the end of the day on January 24, 2015
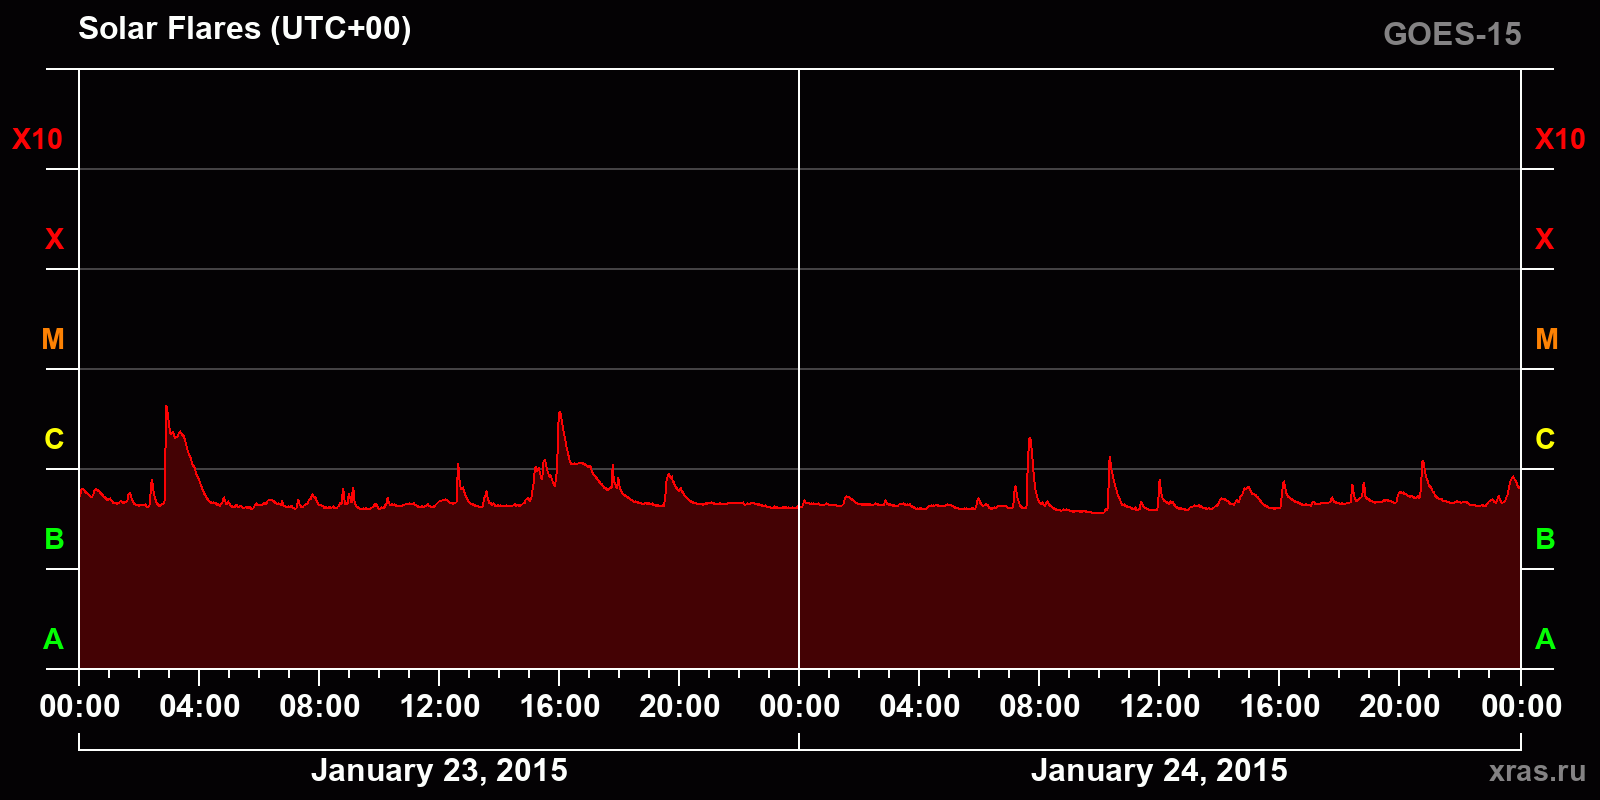
Solar X-ray emission over the past 2 days
Chart of solar X-ray emission (1-8 Å) from January 23, 2015 to January 24, 2015
Time zone — UTC+00 (London)
List of solar flares for January 24, 2015
The total number of solar flares of class C and higher — 3 flares
C class — 3 | M class — 0 | X class — 0
| Class | begin | max | end | region |
|---|---|---|---|---|
| C1.2 | 20:41 | 20:46 | 20:52 | — |
| C1.3 | 10:15 | 10:20 | 10:27 | 2268 |
| C2.0 | 07:32 | 07:40 | 07:46 | 2268 |