Solar flares on October 26, 2010
The most powerful solar flare in 24 hours
C1.1 (normal) flare - October 26 at 2:13 AM
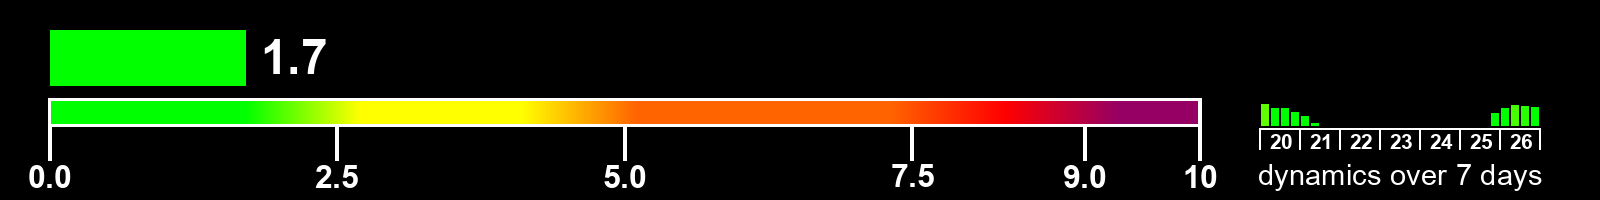
Solar activity index
Value as of the end of the day on October 26, 2010
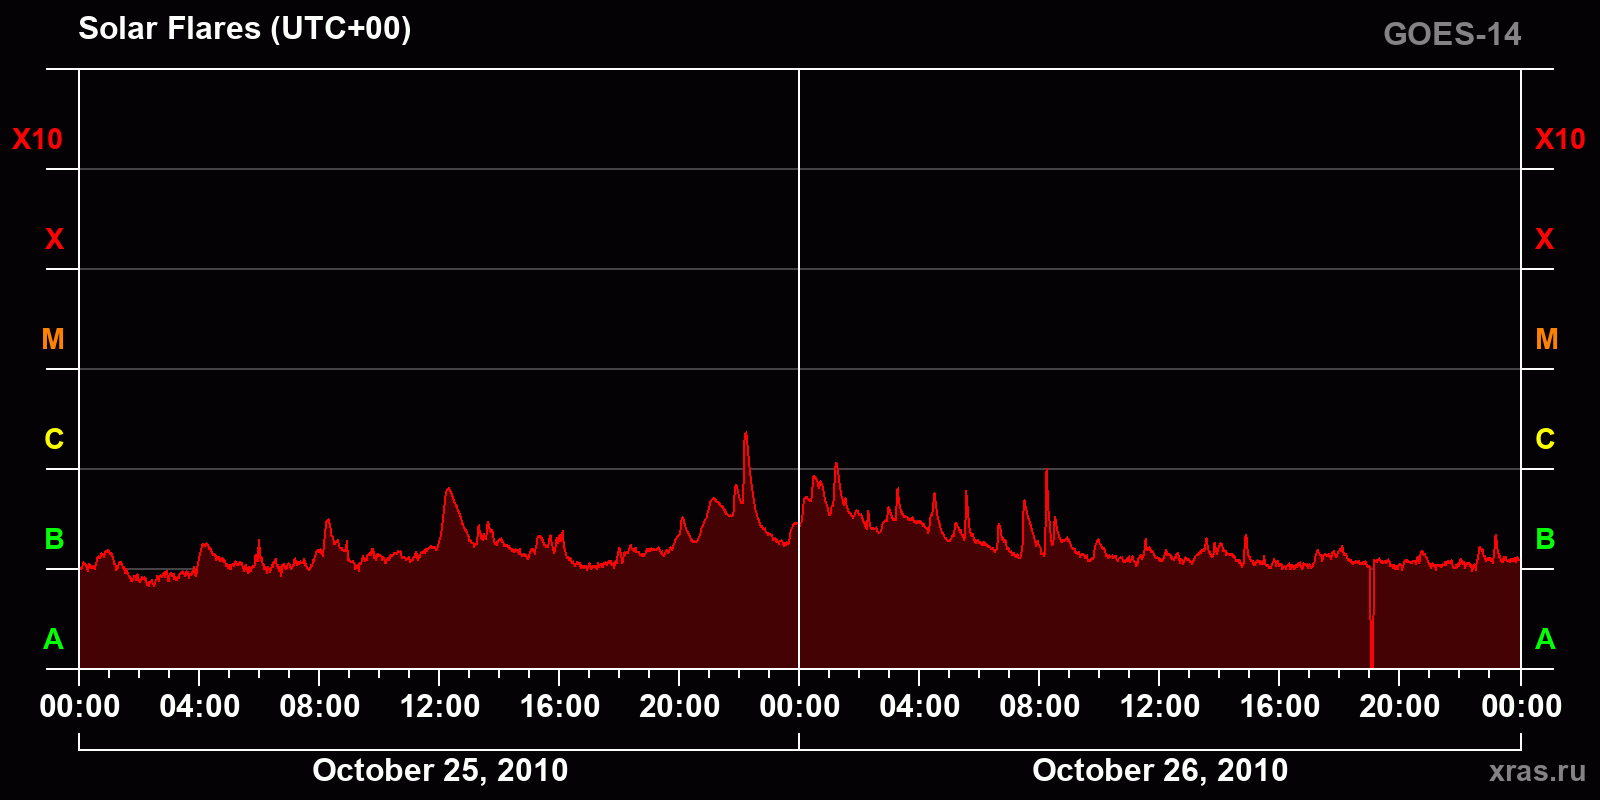
Solar X-ray emission over the past 2 days
Chart of solar X-ray emission (1-8 Å) from October 25, 2010 to October 26, 2010
Time zone — UTC+01 (London) — summer time
List of solar flares for October 26, 2010
The total number of solar flares of class C and higher — 2 flares
C class — 2 | M class — 0 | X class — 0
| Class | begin | max | end | region |
|---|---|---|---|---|
| C1.0 | 09:09 | 09:14 | 09:16 | 1119 |
| C1.1 | 02:06 | 02:13 | 02:19 | — |