

Active areas
Sunspots and active regions
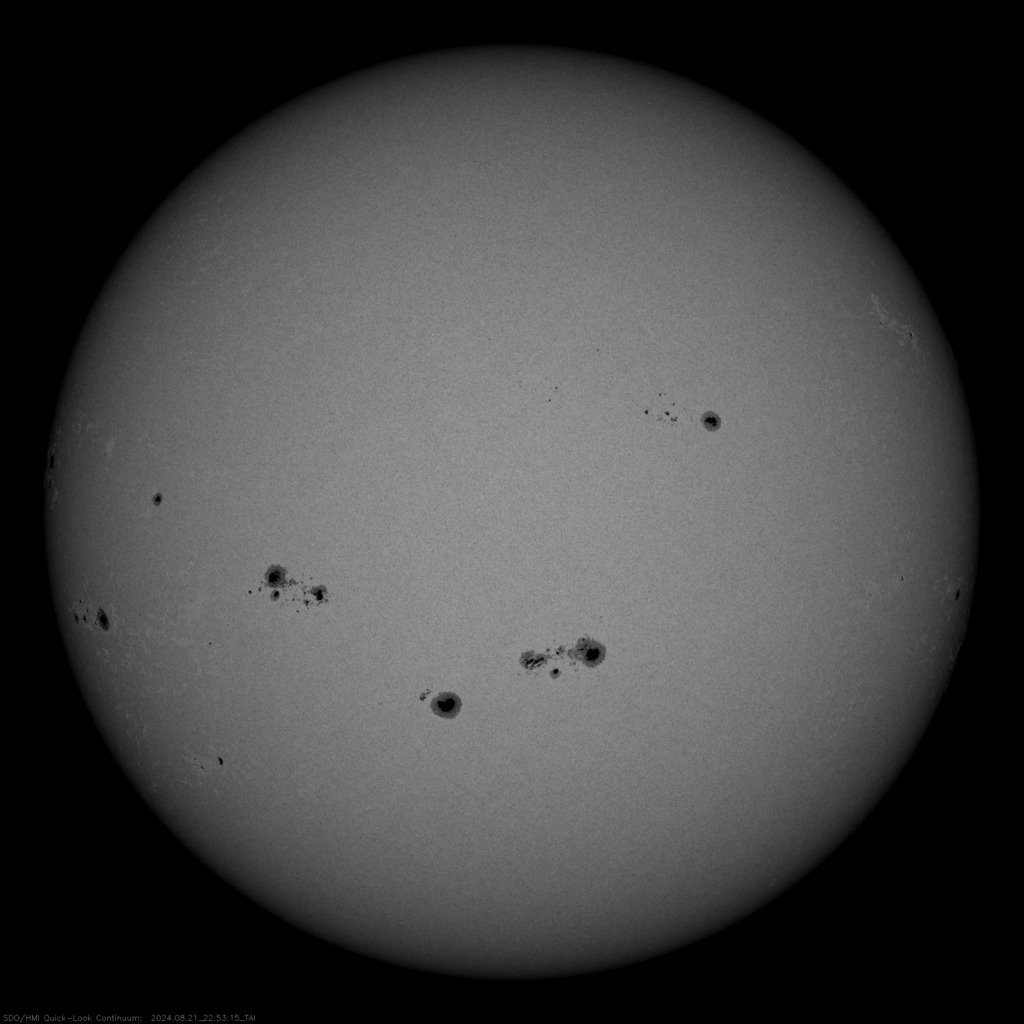
By the end of the day, the following active regions with sunspots could be observed on the Sun's surface
| Group ID | Location | Number of sunspots | Area (msh) | Type | CM Passage | Disappearance (W90) | Reappearance (W270) | |
|---|---|---|---|---|---|---|---|---|
| № 3798 | N06 | E76 | 01 | 0050 | Alpha | Aug 27, 2024 | Sep 2, 2024 | Sep 16, 2024 |
| № 3797 | S05 | W24 | 08 | 0040 | Beta | Aug 19, 2024 | Aug 26, 2024 | Sep 8, 2024 |
| № 3796 | S03 | E57 | 14 | 0180 | Beta-Gamma | Aug 25, 2024 | Sep 1, 2024 | Sep 14, 2024 |
| № 3794 | N18 | E05 | 16 | 0180 | Beta | Aug 21, 2024 | Aug 28, 2024 | Sep 11, 2024 |
| № 3793 | N22 | E22 | 08 | 0180 | Beta | Aug 23, 2024 | Aug 29, 2024 | Sep 12, 2024 |
| № 3792 | S17 | E35 | 01 | 0350 | Beta | Aug 24, 2024 | Aug 30, 2024 | Sep 13, 2024 |
| № 3790 | S12 | E21 | 20 | 0400 | Beta-Gamma | Aug 22, 2024 | Aug 29, 2024 | Sep 12, 2024 |
| № 3789 | N27 | W39 | 10 | 0040 | Beta | Aug 18, 2024 | Aug 25, 2024 | Sep 8, 2024 |
| № 3788 | S08 | W46 | 01 | 0090 | Alpha | Aug 17, 2024 | Aug 24, 2024 | Sep 7, 2024 |
| № 3785 | S14 | W61 | 10 | 0080 | Beta | Aug 16, 2024 | Aug 23, 2024 | Sep 6, 2024 |
| № 3784 | N16 | W70 | 14 | 0650 | Beta-Gamma-Delta | Aug 16, 2024 | Aug 22, 2024 | Sep 5, 2024 |
Solar cycle progression
Average monthly sunspot number (SSN) from 1995, January to 2024, August. Gray background - average solar cycle.
