Active areas
Sunspots and active regions
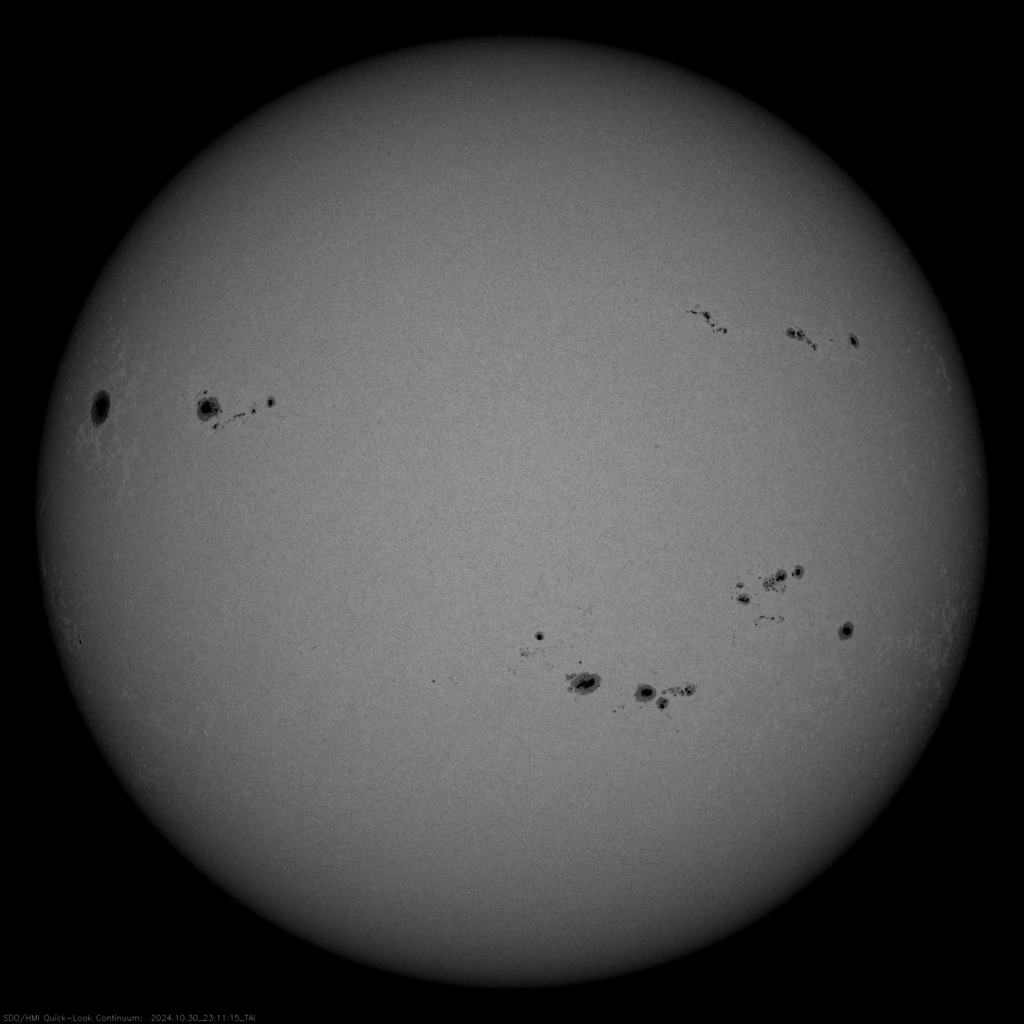
By the end of the day, the following active regions with sunspots could be observed on the Sun's surface
| Group ID | Location | Number of sunspots | Area (msh) | Type | CM Passage | Disappearance (W90) | Reappearance (W270) | |
|---|---|---|---|---|---|---|---|---|
| № 3878 | N18 | E61 | 08 | 0200 | Beta-Gamma | Nov 4, 2024 | Nov 11, 2024 | Nov 24, 2024 |
| № 3877 | S15 | E38 | 01 | 0010 | Alpha | Nov 2, 2024 | Nov 9, 2024 | Nov 22, 2024 |
| № 3876 | S05 | W06 | 30 | 0220 | Beta-Gamma | Oct 30, 2024 | Nov 5, 2024 | Nov 19, 2024 |
| № 3875 | N27 | W10 | 07 | 0020 | Beta | Oct 29, 2024 | Nov 5, 2024 | Nov 19, 2024 |
| № 3874 | N24 | W20 | 25 | 0120 | Beta-Gamma-Delta | Oct 28, 2024 | Nov 4, 2024 | Nov 18, 2024 |
| № 3873 | S12 | E22 | 15 | 0100 | Beta | Nov 1, 2024 | Nov 7, 2024 | Nov 21, 2024 |
| № 3872 | S16 | E14 | 16 | 0390 | Beta-Gamma-Delta | Oct 31, 2024 | Nov 7, 2024 | Nov 21, 2024 |
| № 3870 | S18 | W92 | 02 | 0060 | Beta | Oct 23, 2024 | Oct 30, 2024 | Nov 13, 2024 |
| № 3869 | S15 | W00 | 45 | 0270 | Beta-Gamma-Delta | Oct 30, 2024 | Nov 6, 2024 | Nov 19, 2024 |
| № 3868 | S11 | W22 | 01 | 0150 | Alpha | Oct 28, 2024 | Nov 4, 2024 | Nov 18, 2024 |
| № 3866 | S12 | W36 | 04 | 0010 | Beta | Oct 27, 2024 | Nov 3, 2024 | Nov 17, 2024 |
| № 3863 | S08 | W63 | 07 | 0060 | Beta | Oct 25, 2024 | Nov 1, 2024 | Nov 15, 2024 |
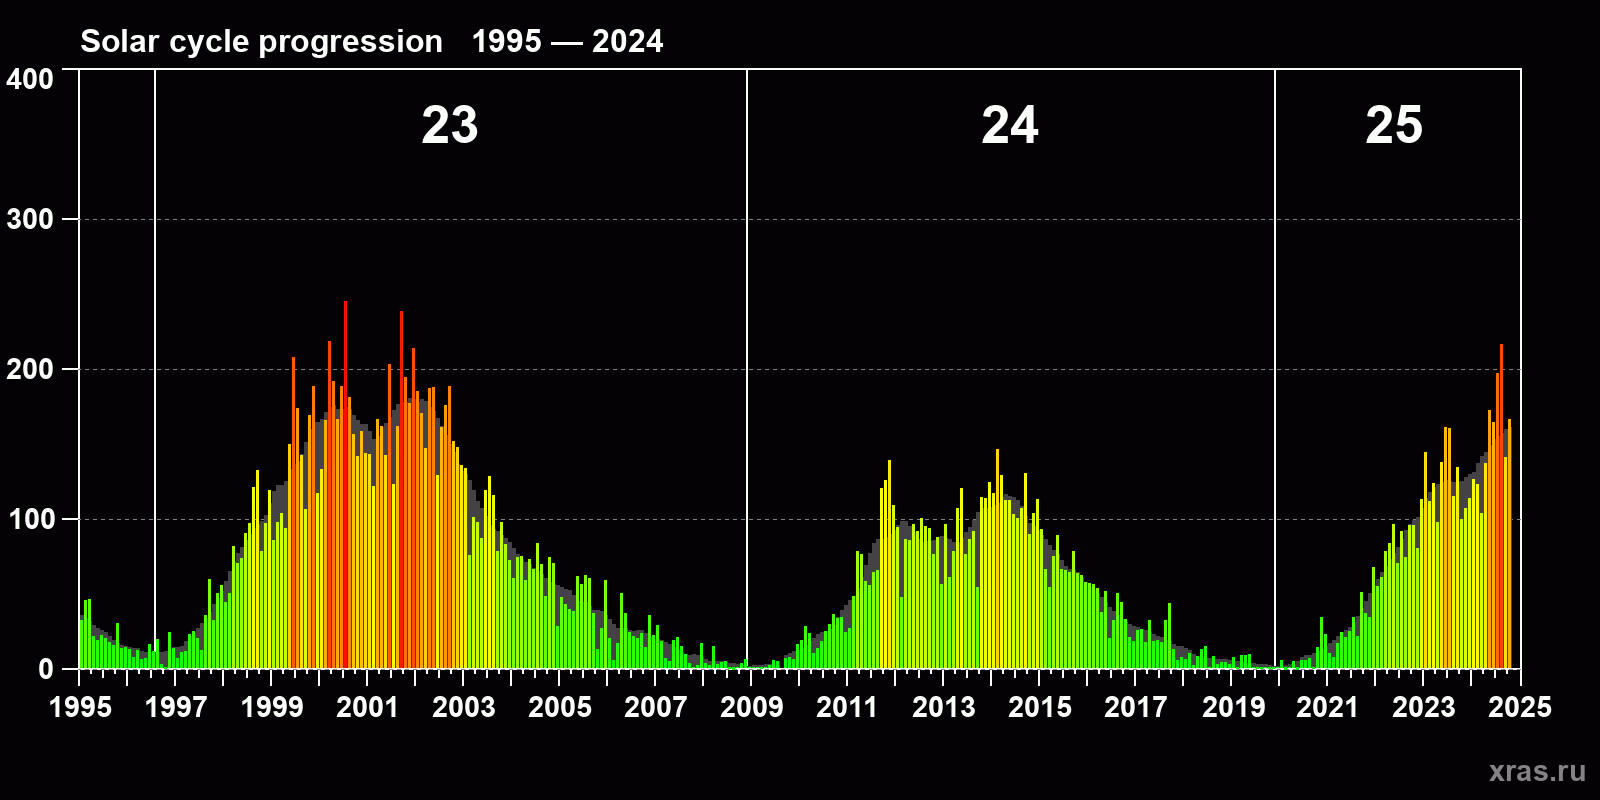
Solar cycle progression
Average monthly sunspot number (SSN) from 1995, January to 2024, October. Gray background - average solar cycle.