Sunspots and active regions
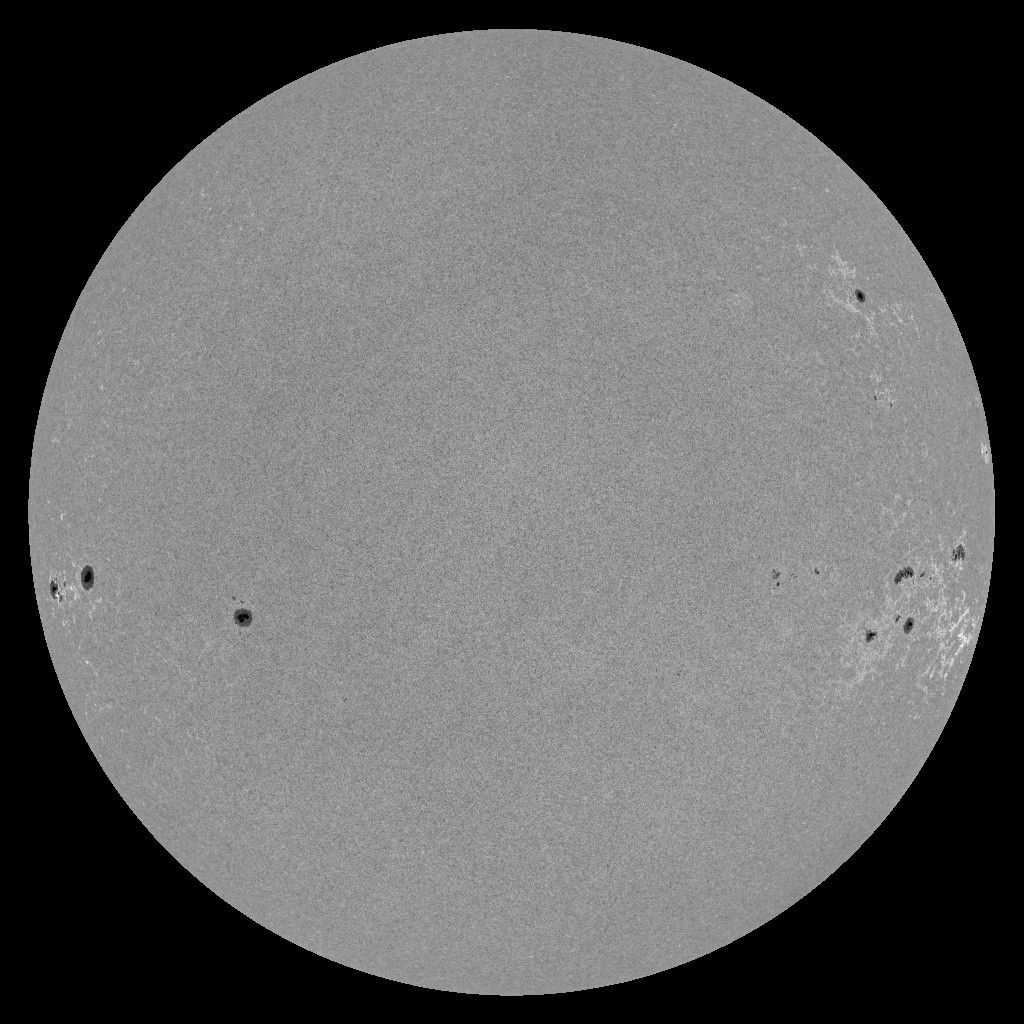
The following active regions with sunspot groups were visible on the Sun on January 5, 2026. Coordinates are given as of the end of the day.
| Group ID | Location | Number of sunspots | Area (msh) | Type | CM Passage | Disappearance (W90) | Reappearance (W270) | |
|---|---|---|---|---|---|---|---|---|
| № 4336 | S09 | E79 | 01 | 0060 | Alpha | Jan 12, 2026 | Jan 19, 2026 | Feb 1, 2026 |
| № 4335 | S22 | W10 | 01 | 0010 | Alpha | Jan 5, 2026 | Jan 12, 2026 | Jan 26, 2026 |
| № 4334 | S17 | E50 | 02 | 0120 | Alpha | Jan 10, 2026 | Jan 17, 2026 | Jan 30, 2026 |
| № 4333 | S10 | W24 | 10 | 0060 | Beta | Jan 4, 2026 | Jan 11, 2026 | Jan 24, 2026 |
| № 4325 | S08 | W49 | 07 | 0300 | Beta-Gamma | Jan 2, 2026 | Jan 9, 2026 | Jan 22, 2026 |
| № 4324 | N26 | W38 | 03 | 0070 | Beta | Jan 3, 2026 | Jan 10, 2026 | Jan 24, 2026 |
| № 4323 | S15 | W42 | 03 | 0190 | Beta | Jan 3, 2026 | Jan 9, 2026 | Jan 23, 2026 |
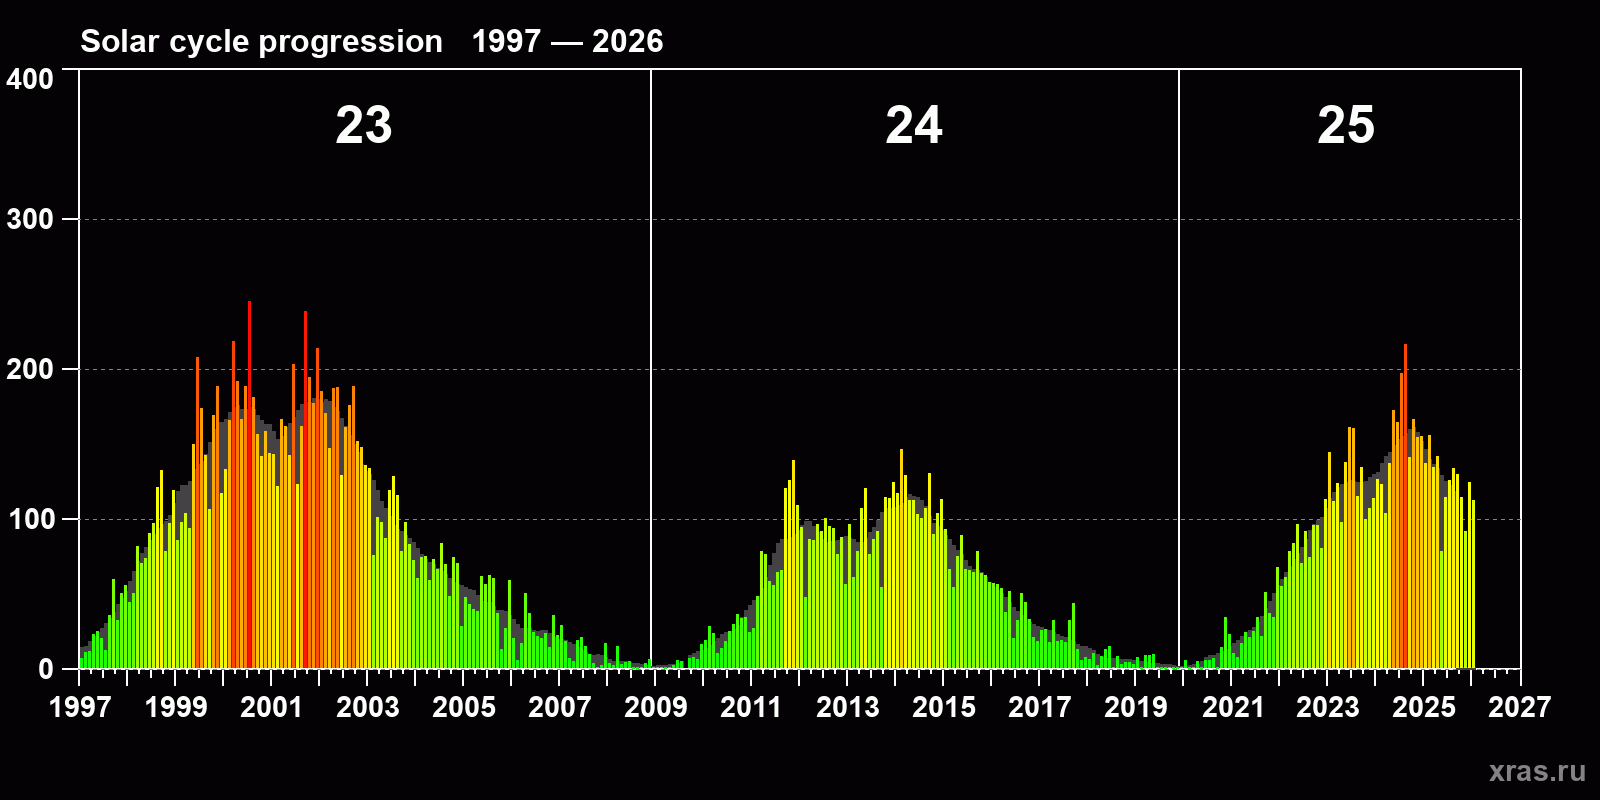
Solar cycle progression
The average monthly sunspot number (SSN) from January 1997 to January 2026. The gray background is the average SSN index.