Solar flares on January 19, 2026
The most powerful solar flare in 24 hours
X1.9 (very strong) flare - January 19 at 1:09 AM
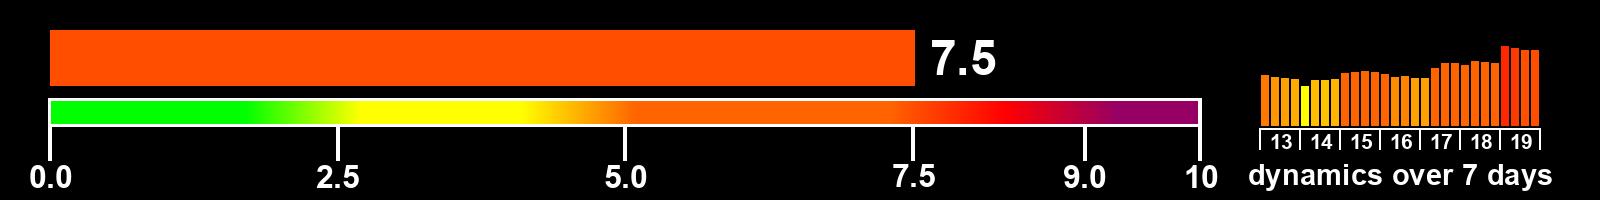
Solar activity index
Value as of the end of the day on January 19, 2026
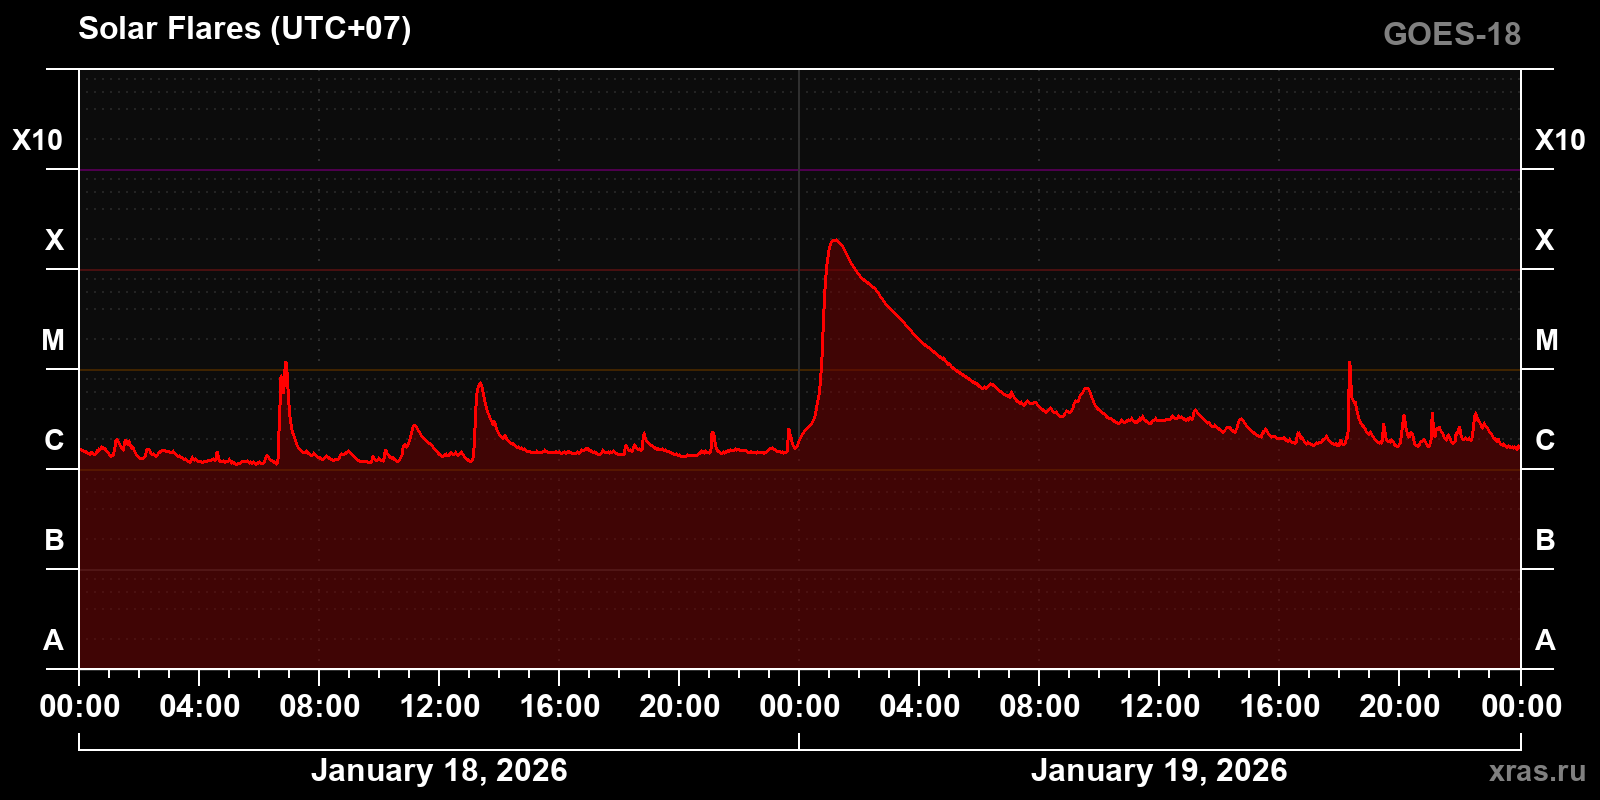
Solar X-ray emission over the past 2 days
Chart of solar X-ray emission (1-8 Å) from January 18, 2026 to January 19, 2026
Time zone — UTC+07 (Norilsk)
List of solar flares for January 19, 2026
The total number of solar flares of class C and higher — 6 flares
C class — 4 | M class — 1 | X class — 1
| Class | begin | max | end | region |
|---|---|---|---|---|
| C3.6 | 22:22 | 22:31 | 22:42 | 4345 |
| C3.6 | 20:57 | 21:04 | 21:07 | 4345 |
| C3.4 | 19:57 | 20:07 | 20:12 | 4345 |
| C2.8 | 19:23 | 19:27 | 19:30 | 4345 |
| M1.1 | 18:09 | 18:19 | 18:22 | 4345 |
| X1.9 | 00:27 | 01:09 | 01:51 | 4341 |