
Solar flares on March 9, 2014
The most powerful solar flare in 24 hours
M1.4 (strong) flare - March 9 at 1:41 AM
Solar activity index
Value as of the end of the day on March 9, 2014

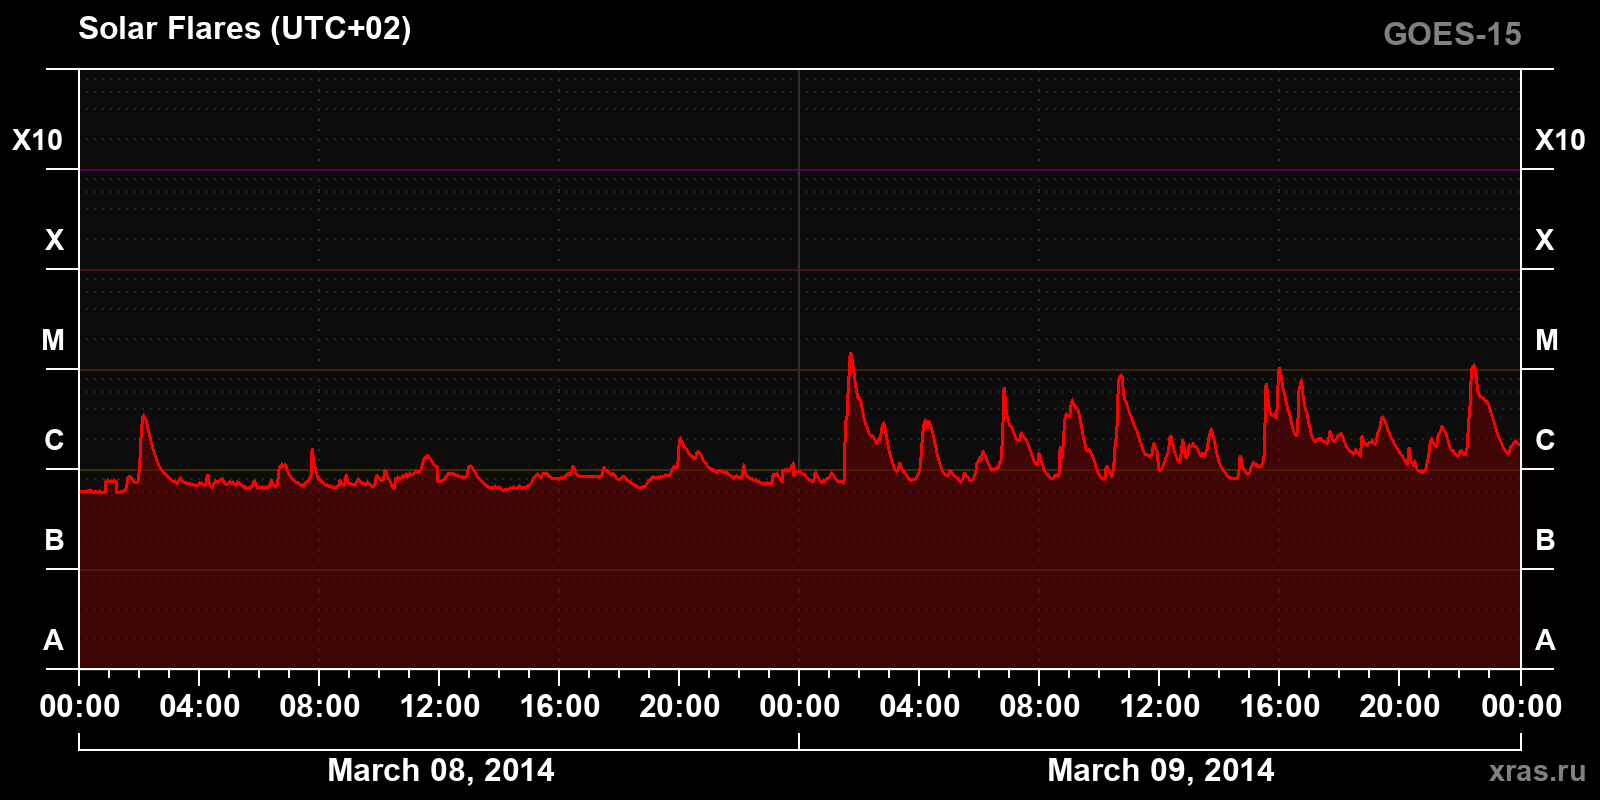
Solar X-ray emission over the past 2 days
Chart of solar X-ray emission (1-8 Å) from March 8, 2014 to March 9, 2014
Time zone — UTC+02 (Riga)
List of solar flares for March 9, 2014
The total number of solar flares of class C and higher — 14 flares
C class — 11 | M class — 3 | X class — 0
| Class | begin | max | end | region |
|---|---|---|---|---|
| M1.0 | 22:13 | 22:28 | 22:35 | 2002 |
| C1.6 | 20:15 | 20:18 | 20:20 | 2002 |
| C2.1 | 18:40 | 18:43 | 18:52 | 2002 |
| C7.7 | 16:33 | 16:42 | 16:47 | 2002 |
| M1.0 | 15:52 | 15:58 | 16:05 | 2002 |
| C7.1 | 15:26 | 15:32 | 15:38 | 2002 |
| C1.3 | 14:36 | 14:41 | 14:44 | 1996 |
| C1.9 | 12:39 | 12:45 | 12:49 | 2002 |
| C2.1 | 12:01 | 12:20 | 12:28 | 1996 |
| C4.8 | 08:36 | 09:04 | 09:22 | 2002 |
| C6.5 | 06:41 | 06:48 | 06:52 | 2002 |
| C3.0 | 03:59 | 04:17 | 04:28 | 2002 |
| C2.8 | 02:35 | 02:46 | 02:51 | 2002 |
| M1.4 | 01:26 | 01:41 | 01:50 | 2002 |