

Active areas
Sunspots and active regions
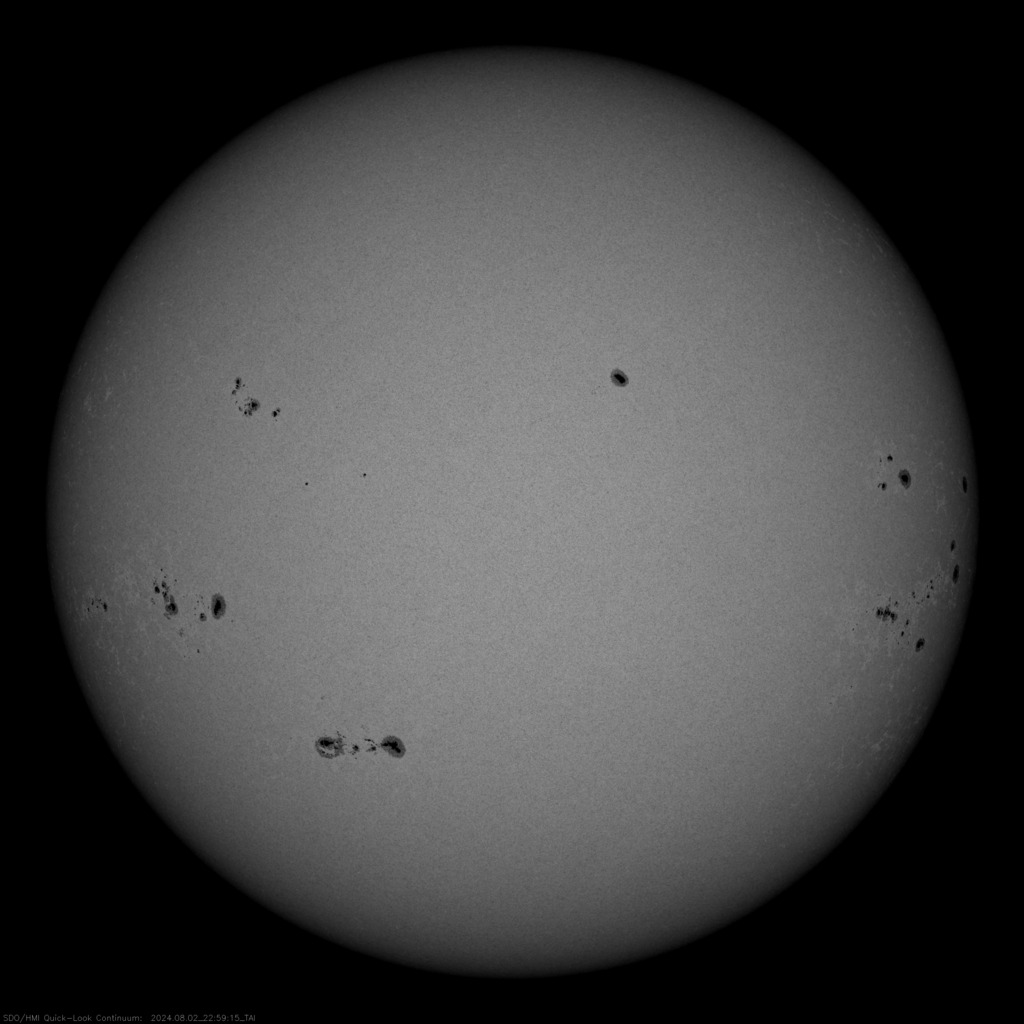
By the end of the day, the following active regions with sunspots could be observed on the Sun's surface
| Group ID | Location | Number of sunspots | Area (msh) | Type | CM Passage | Disappearance (W90) | Reappearance (W270) | |
|---|---|---|---|---|---|---|---|---|
| № 3776 | N10 | E36 | 04 | 0030 | Beta | Aug 6, 2024 | Aug 12, 2024 | Aug 26, 2024 |
| № 3775 | N17 | E48 | 04 | 0040 | Beta | Aug 7, 2024 | Aug 13, 2024 | Aug 27, 2024 |
| № 3774 | S06 | E57 | 02 | 0250 | Beta-Gamma | Aug 7, 2024 | Aug 14, 2024 | Aug 27, 2024 |
| № 3773 | S06 | W71 | 03 | 0020 | Beta | Jul 29, 2024 | Aug 4, 2024 | Aug 18, 2024 |
| № 3772 | S25 | E36 | 12 | 0240 | Beta-Gamma-Delta | Aug 6, 2024 | Aug 13, 2024 | Aug 27, 2024 |
| № 3770 | N07 | W43 | 12 | 0310 | Beta-Delta | Jul 31, 2024 | Aug 6, 2024 | Aug 20, 2024 |
| № 3769 | N22 | W02 | 01 | 0080 | Alpha | Aug 3, 2024 | Aug 10, 2024 | Aug 23, 2024 |
| № 3768 | S16 | W83 | 24 | 0500 | Beta-Gamma-Delta | Jul 28, 2024 | Aug 3, 2024 | Aug 17, 2024 |
| № 3767 | S09 | W36 | 15 | 0130 | Beta-Delta | Jul 31, 2024 | Aug 7, 2024 | Aug 20, 2024 |
| № 3766 | S07 | W53 | 21 | 0180 | Beta-Gamma | Jul 30, 2024 | Aug 6, 2024 | Aug 19, 2024 |
| № 3765 | S11 | W45 | 28 | 0450 | Beta-Gamma-Delta | Jul 30, 2024 | Aug 6, 2024 | Aug 20, 2024 |
| № 3764 | S03 | W60 | 03 | 0070 | Beta | Jul 29, 2024 | Aug 5, 2024 | Aug 19, 2024 |
| № 3763 | N05 | W62 | 01 | 0060 | Alpha | Jul 29, 2024 | Aug 5, 2024 | Aug 18, 2024 |
Solar cycle progression
Average monthly sunspot number (SSN) from 1995, January to 2024, August. Gray background - average solar cycle.
